Continuum SDR
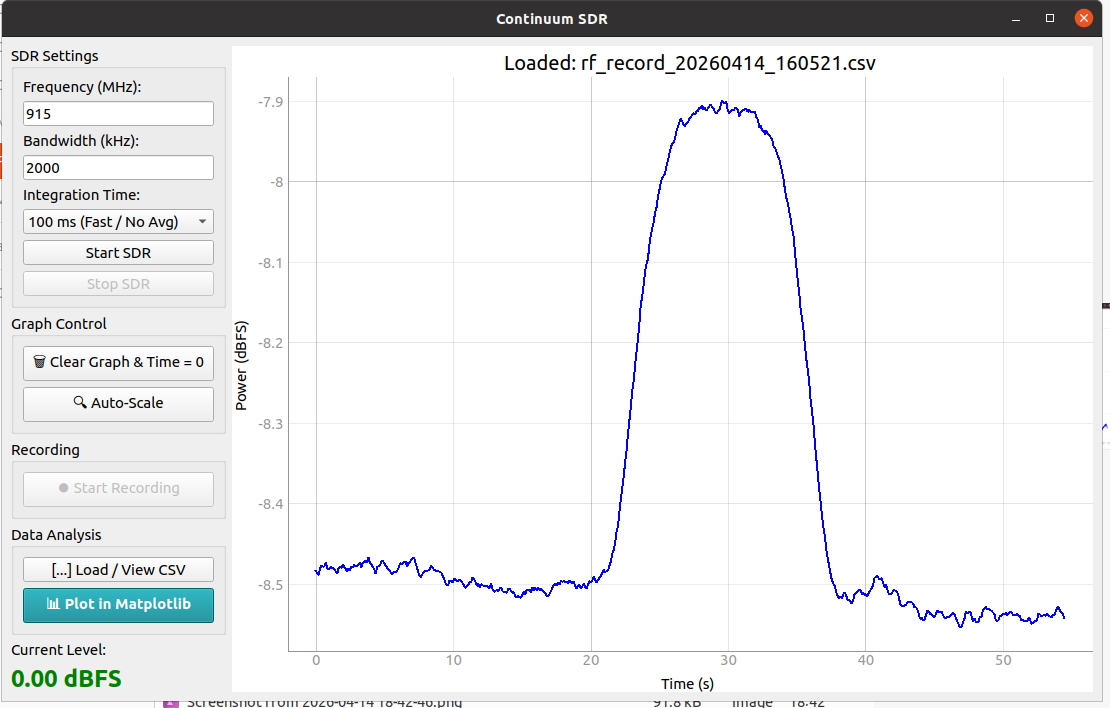
SDR - Continuum Live Plotter
Continuum SDR is a specialized software solution designed for radio astronomy and general RF power measurement. Its primary objective is to visualize, display, record, and analyze total power diagrams in real-time. The program utilizes the SoapySDR abstraction layer, making it compatible with a wide range of Software Defined Radio hardware. While optimized for SDRplay devices, it supports any SDR provided the appropriate SoapySDR drivers and layers are correctly installed on the host system.
System Requirements
The application requires a connected SDR device supported by SoapySDR. Users must ensure that the SoapySDR framework is installed on their operating system, including all vendor-specific hardware drivers and the corresponding SoapySDR modules for their device.
Core Features
The core functions are very similar to those of “Continuum SR.” However, there are specific features that result from the use of an SDR: The core functions are very similar to those of “Continuum SR.” However, there are specific features that result from the use of an SDR. Unlike the broadband detector (“Second Receiver”), you can manually adjust the center frequency and bandwidth here.
Hardware Control and Acquisition
- Adjustable Center Frequency: Precise tuning to the target frequency for observations.
- Selectable Bandwidth: Flexible bandwidth settings to optimize sensitivity and signal capture.
- Live Data Acquisition: High-speed real-time data streaming and visualization of RF power levels.
Signal Processing and Integration
- Variable Integration Time: Adjustable time constants for signal averaging to improve the signal-to-noise ratio.
- Dynamic Smoothing: Implementation of a sliding window integrator that provides smooth visual updates while maintaining high temporal resolution.
- Advanced Data Processing: Includes tools for baseline zeroing, conversion to linear power scales, and calculation of effective noise temperature.
Visualization and Analysis
- Auto Scaling and Zooming: Intelligent axis scaling and interactive zooming capabilities for detailed inspection of signal fluctuations.
- Data Logging: Continuous recording of measurements into standardized CSV formats for long-term study.
- Offline File Viewer: Built-in functionality to load, view, and navigate previously recorded data sessions without hardware connected.
- Publication-Ready Plotting: Integration with Matplotlib to generate high-quality, professional charts suitable for scientific reports and publications, including support for detailed observation metadata.