Small experiments
In the following, a series of small experiments using the Second Receiver are presented. At the same time, these experiments serve to verify key predictions of the radiometer equation under practical conditions.
Experiment 1: Effect of Antenna Aperture
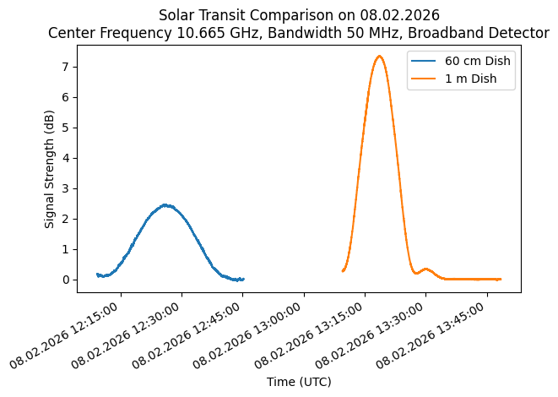
The figure shows a comparison of a solar transit observed with two different antennas:
- a 1-meter prime-focus dish
- a 60 cm Cassegrain dish
Both observations were conducted in the Ku-band under comparable conditions.
Two important effects can be clearly observed:
- The smaller dish exhibits a broader beamwidth, which results in a wider transit curve.
- The amplitude of the solar signal is significantly lower for the 60 cm dish.
This behavior directly reflects the predictions of the radiometer equation. The sensitivity of a radio telescope depends on its effective aperture (proportional to \(\eta D^2\)). A smaller dish collects less radiation, leading to a lower antenna temperature and thus a smaller detectable signal.
In summary, the experiment demonstrates that:
- A larger antenna aperture results in a narrower beam and a higher signal amplitude.
- A smaller antenna leads to reduced sensitivity and broader angular response.
Experiment 2: The Sun’s Radio Brightness at Different Frequencies
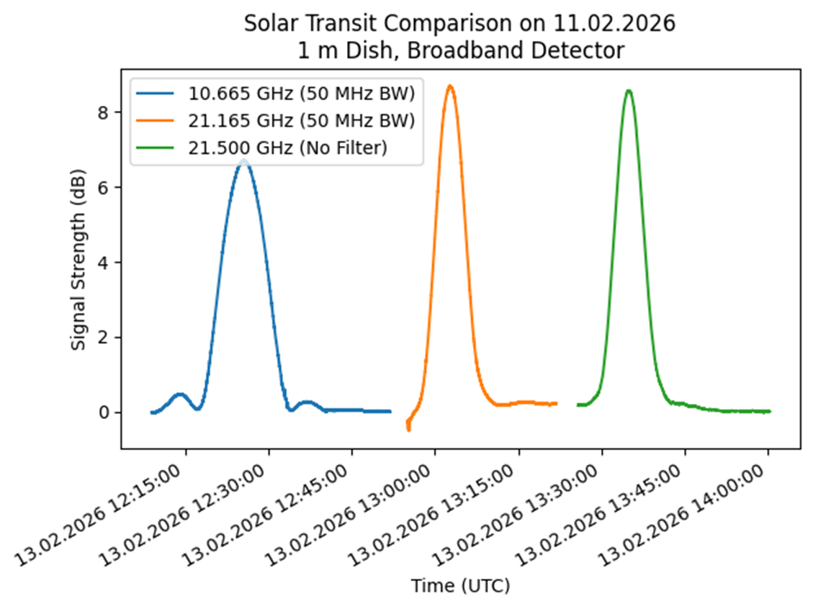
The figure shows a comparison of solar transits observed with the same 1-meter dish, but at different frequencies:
- 10.665 GHz (Ku-band, 50 MHz bandwidth)
- 21.165 GHz (Ka-band, 50 MHz bandwidth)
- 21.500 GHz (Ka-band, no filter / very large bandwidth)
Despite using the same antenna aperture, two important effects can be clearly observed:
- The beamwidth in the Ka-band is significantly narrower.
- The signal amplitude is higher at the higher frequencies.
The narrower beamwidth is a direct consequence of the shorter wavelength. According to antenna theory, the angular resolution (HPBW) scales approximately with \(\lambda / D\). Therefore, at higher frequencies (shorter wavelengths), the beam becomes narrower even if the dish size remains unchanged.
The increased signal amplitude reflects the intrinsic nature of the Sun as a thermal emitter. Thermal sources exhibit higher brightness temperatures at higher microwave frequencies, which leads to a stronger detected signal in the Ka-band compared to the Ku-band.
In addition, the measurement at 21.5 GHz without a bandpass filter benefits from a significantly larger effective bandwidth. This further improves the signal-to-noise ratio, making the solar transit appear even more clearly.
In summary, this experiment demonstrates:
- Higher observing frequencies lead to better angular resolution (narrower beam).
- Thermal sources like the Sun show increased radio brightness at higher frequencies.
- A larger bandwidth further enhances detectability by reducing noise.
Experiment 3: Sun vs. Moon at Different Frequencies
This experiment compares the relative radio brightness of the Sun and the Moon at different observing frequencies.
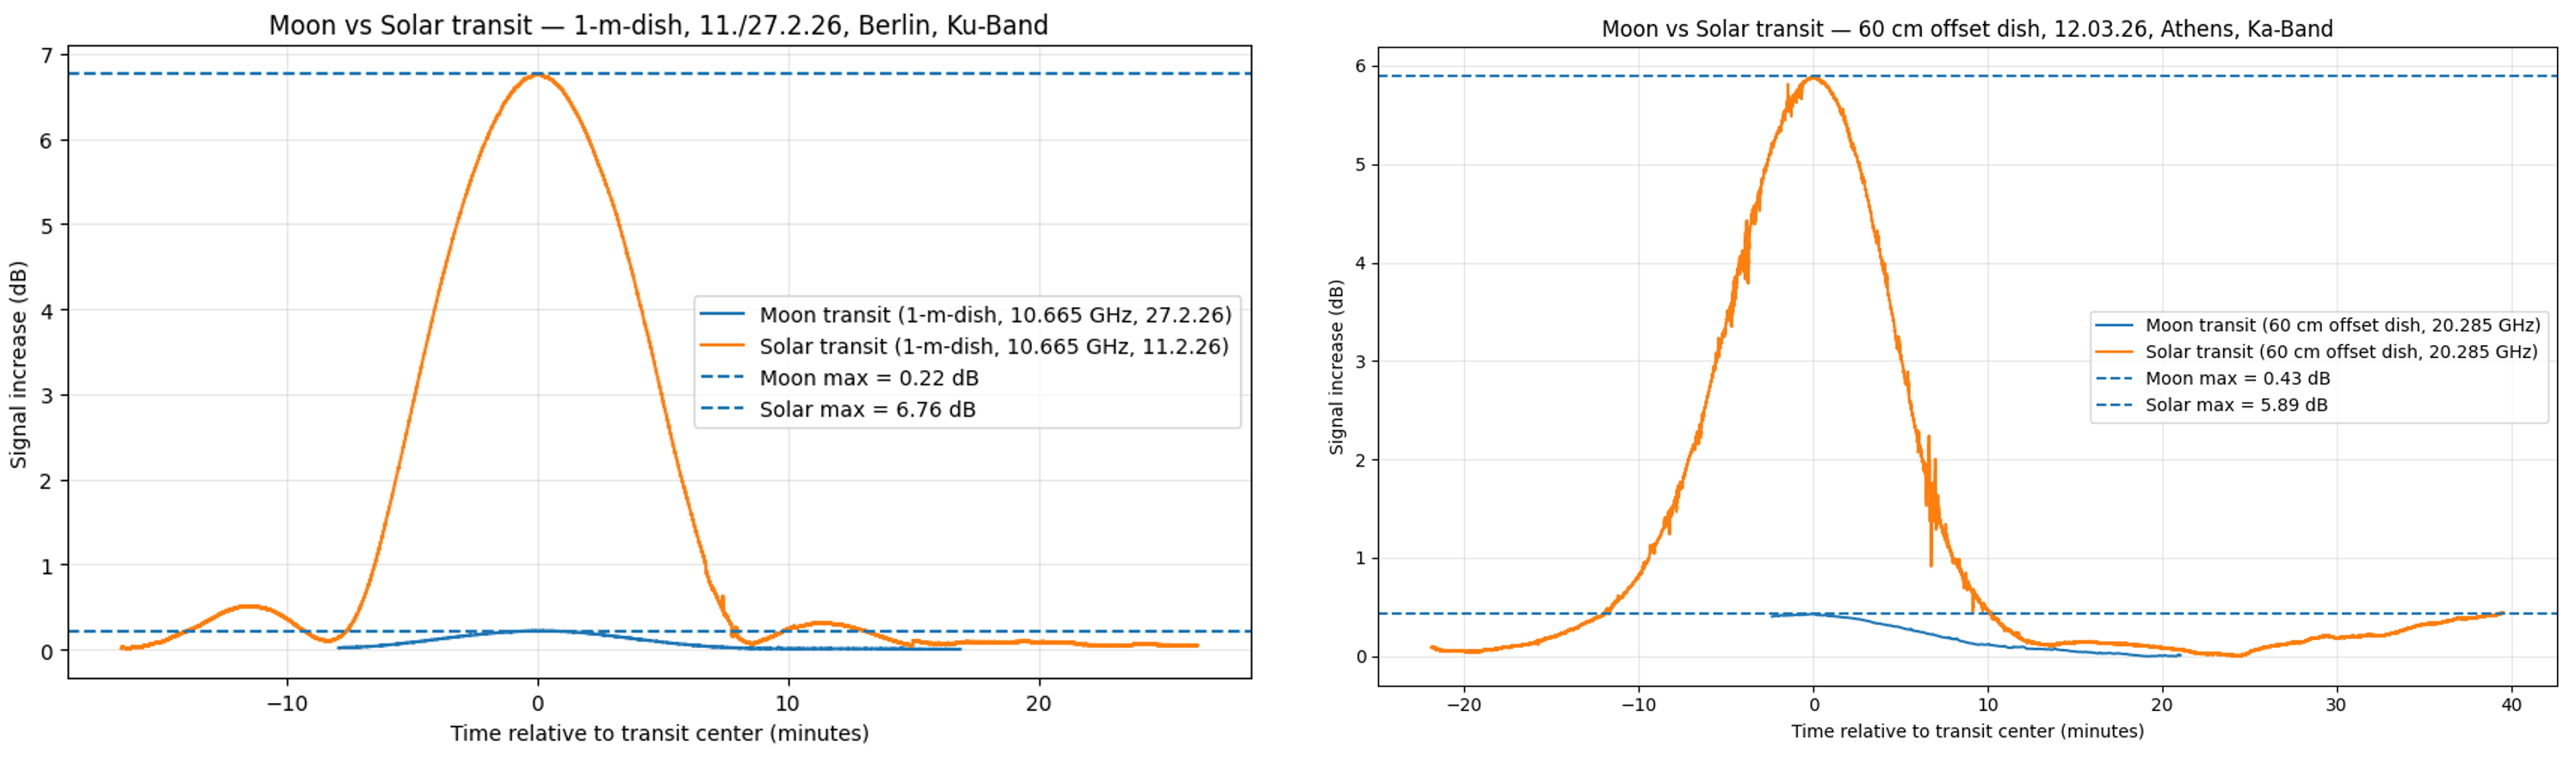
- Image 1 shows a comparison of solar and lunar transits in the Ku-band (10.665 GHz) using a 1-meter dish.
- Image 2 shows the same comparison in the Ka-band (≈20 GHz) using a 60 cm offset dish.
A key result is that the ratio between solar and lunar signal strength changes with frequency:
- In the Ku-band, the signal is clearly dominated by the Sun. The lunar signal is comparatively weak.
- In the Ka-band, the Moon appears relatively brighter compared to the Sun, and the ratio between both signals becomes smaller.
This behavior can be explained by the different emission mechanisms:
- In the Ku-band, a noticeable fraction of the Sun’s emission already includes non-thermal contributions (e.g. from active regions and magnetic processes), which enhance its brightness relative to the Moon.
- In the Ka-band, the emission is closer to a purely thermal regime, where both the Sun and the Moon behave more like thermal emitters. As a result, their relative brightness becomes more comparable.
In addition, the Moon — being a thermal emitter with a relatively smooth spectrum — shows a strong increase in brightness toward higher microwave frequencies, which further contributes to its more prominent appearance in the Ka-band.
In summary, this experiment demonstrates:
- The relative brightness of astronomical sources depends strongly on observing frequency.
- The Sun’s emission mechanism changes with frequency, transitioning from partly non-thermal to predominantly thermal.
- The Moon becomes increasingly detectable at higher frequencies, making it an excellent calibration source in the Ka-band.
This highlights once again how both frequency selection and source physics play a crucial role in continuum radio astronomy.
Experiment 4: Effect of Integration Time in the Ka-Band
This experiment demonstrates the influence of integration time on the detectability of a weak continuum source.
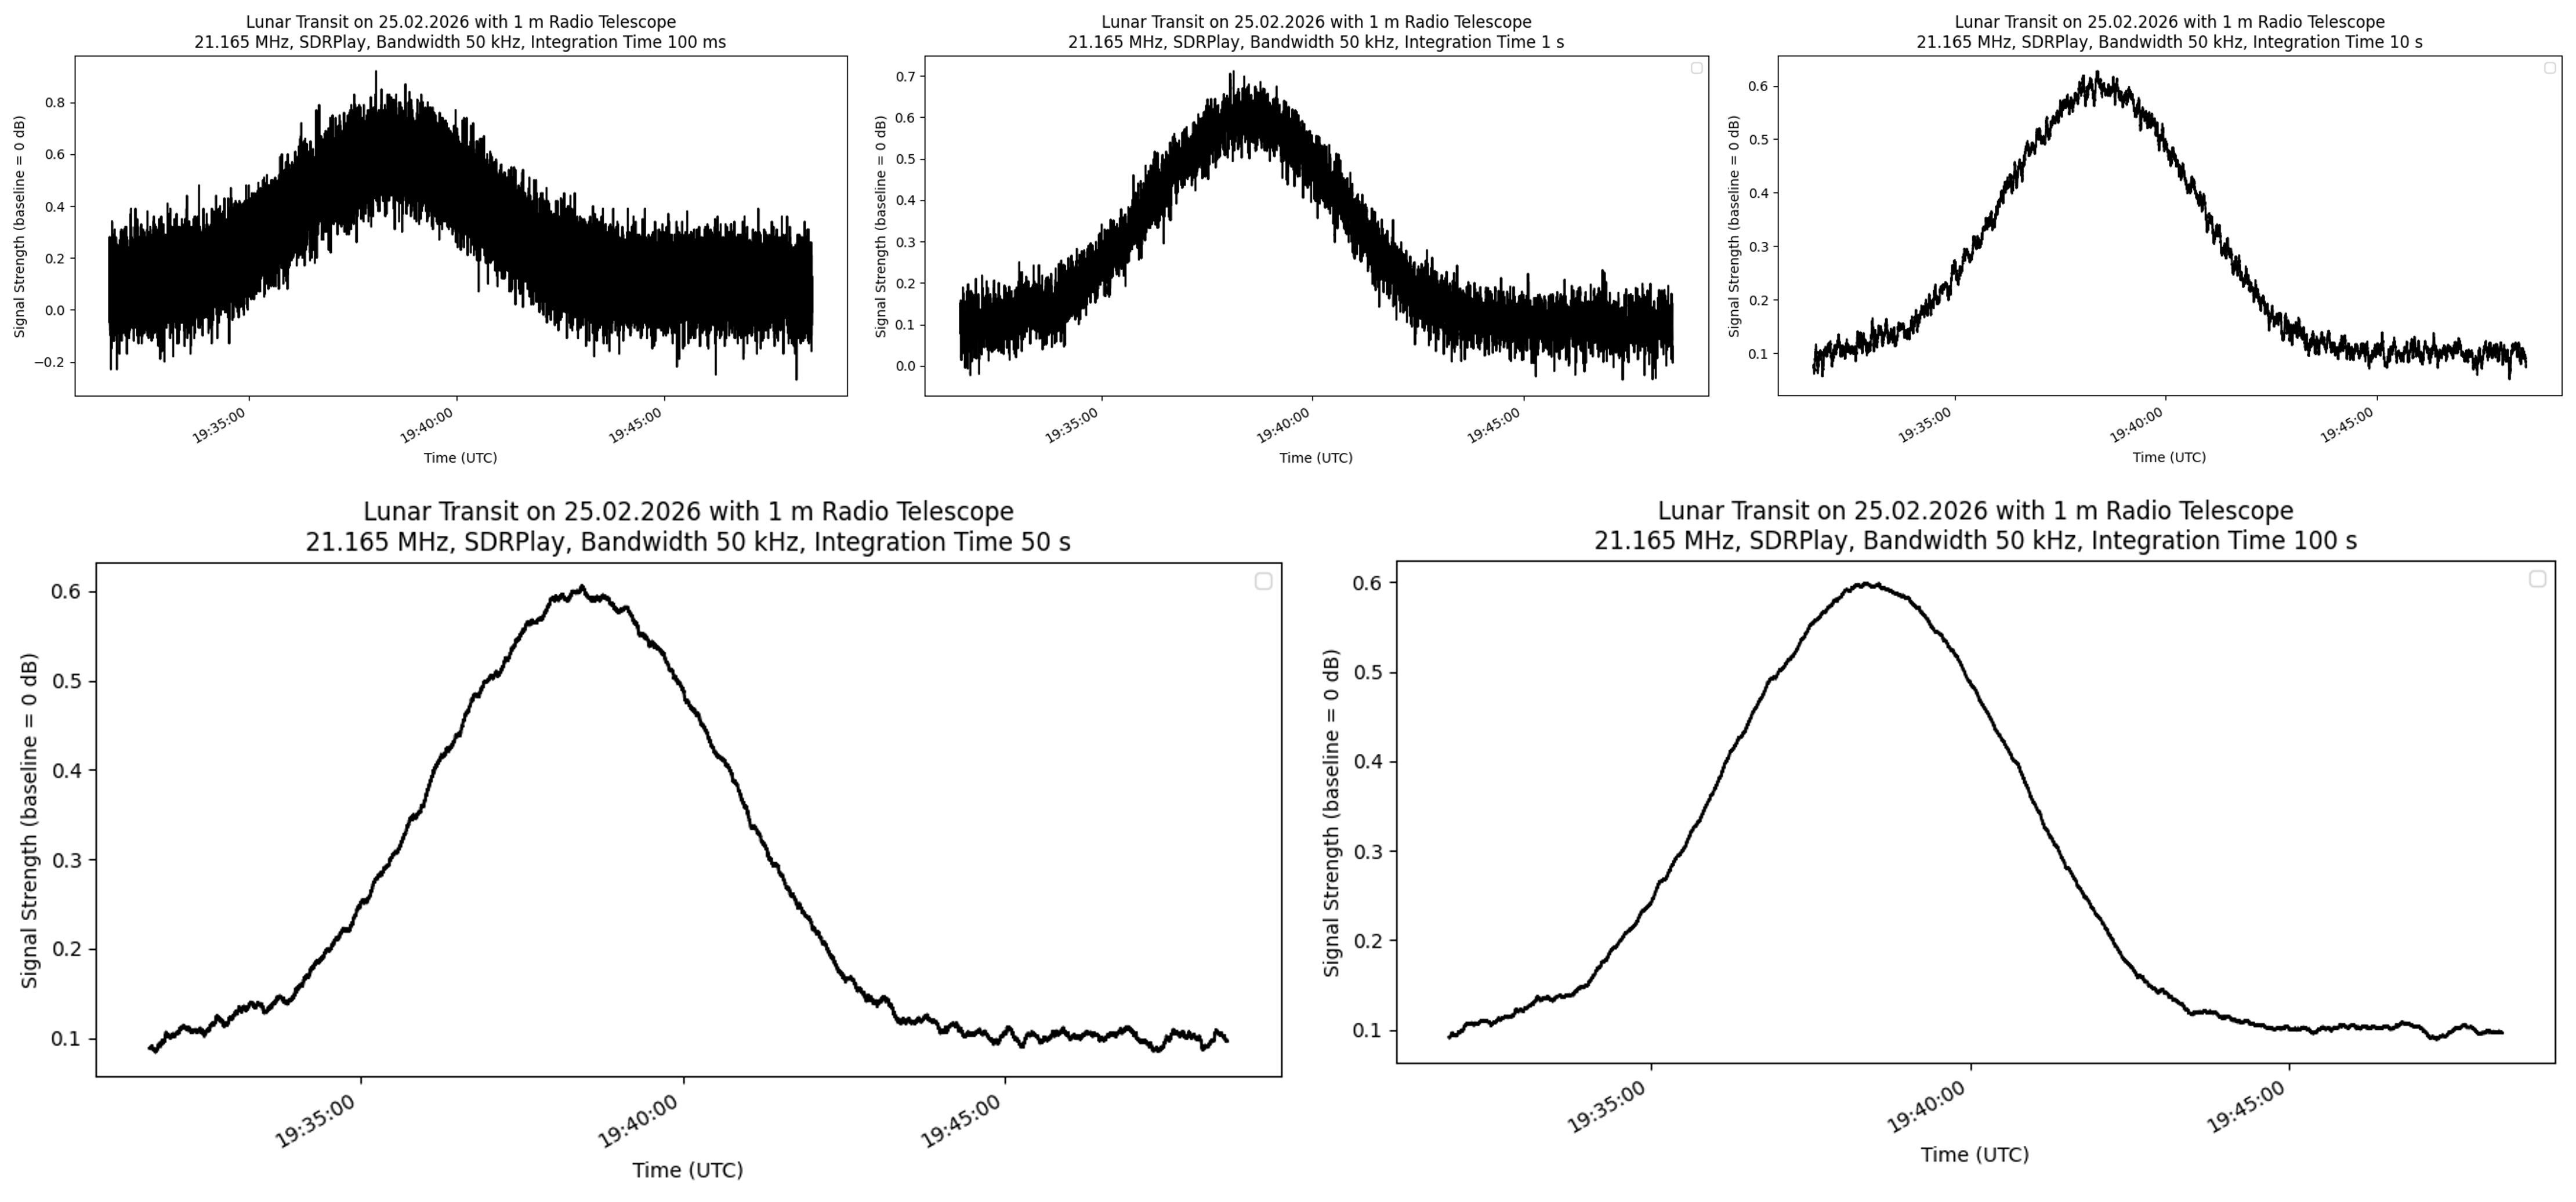
The figure shows a comparison of lunar transits observed with a 1-meter dish in the Ka-band. All measurements were conducted with a narrow bandwidth of 50 kHz.
Different integration times were applied using a moving average:
- 100 ms
- 1 s
- 10 s
- 50 s
- 100 s
A clear effect can be observed:
- The noise level decreases significantly with increasing integration time.
- The maximum signal increase relative to the baseline remains unchanged.
This behavior is a direct confirmation of the radiometer equation. Increasing the integration time does not amplify the signal itself, but instead reduces the statistical fluctuations of the noise. As a result, the lunar signal becomes progressively more visible and clearly defined.
In other words:
Longer integration improves detectability by reducing noise, not by increasing the signal.
To achieve the narrow bandwidth required for this experiment, an SDRplay receiver was used. A custom Python program was implemented to provide an interface (bridge) to Radio SkyPipe, enabling continuous data acquisition and real-time visualization.
This experiment highlights the fundamental trade-off described by the radiometer equation: even with limited bandwidth, increasing the integration time allows weak signals to emerge from the noise — albeit only with the characteristic square-root improvement.
Experiment 5: Effect of Bandwidth in the Ka-Band
This experiment demonstrates the influence of receiver bandwidth on the detectability of a weak continuum source.
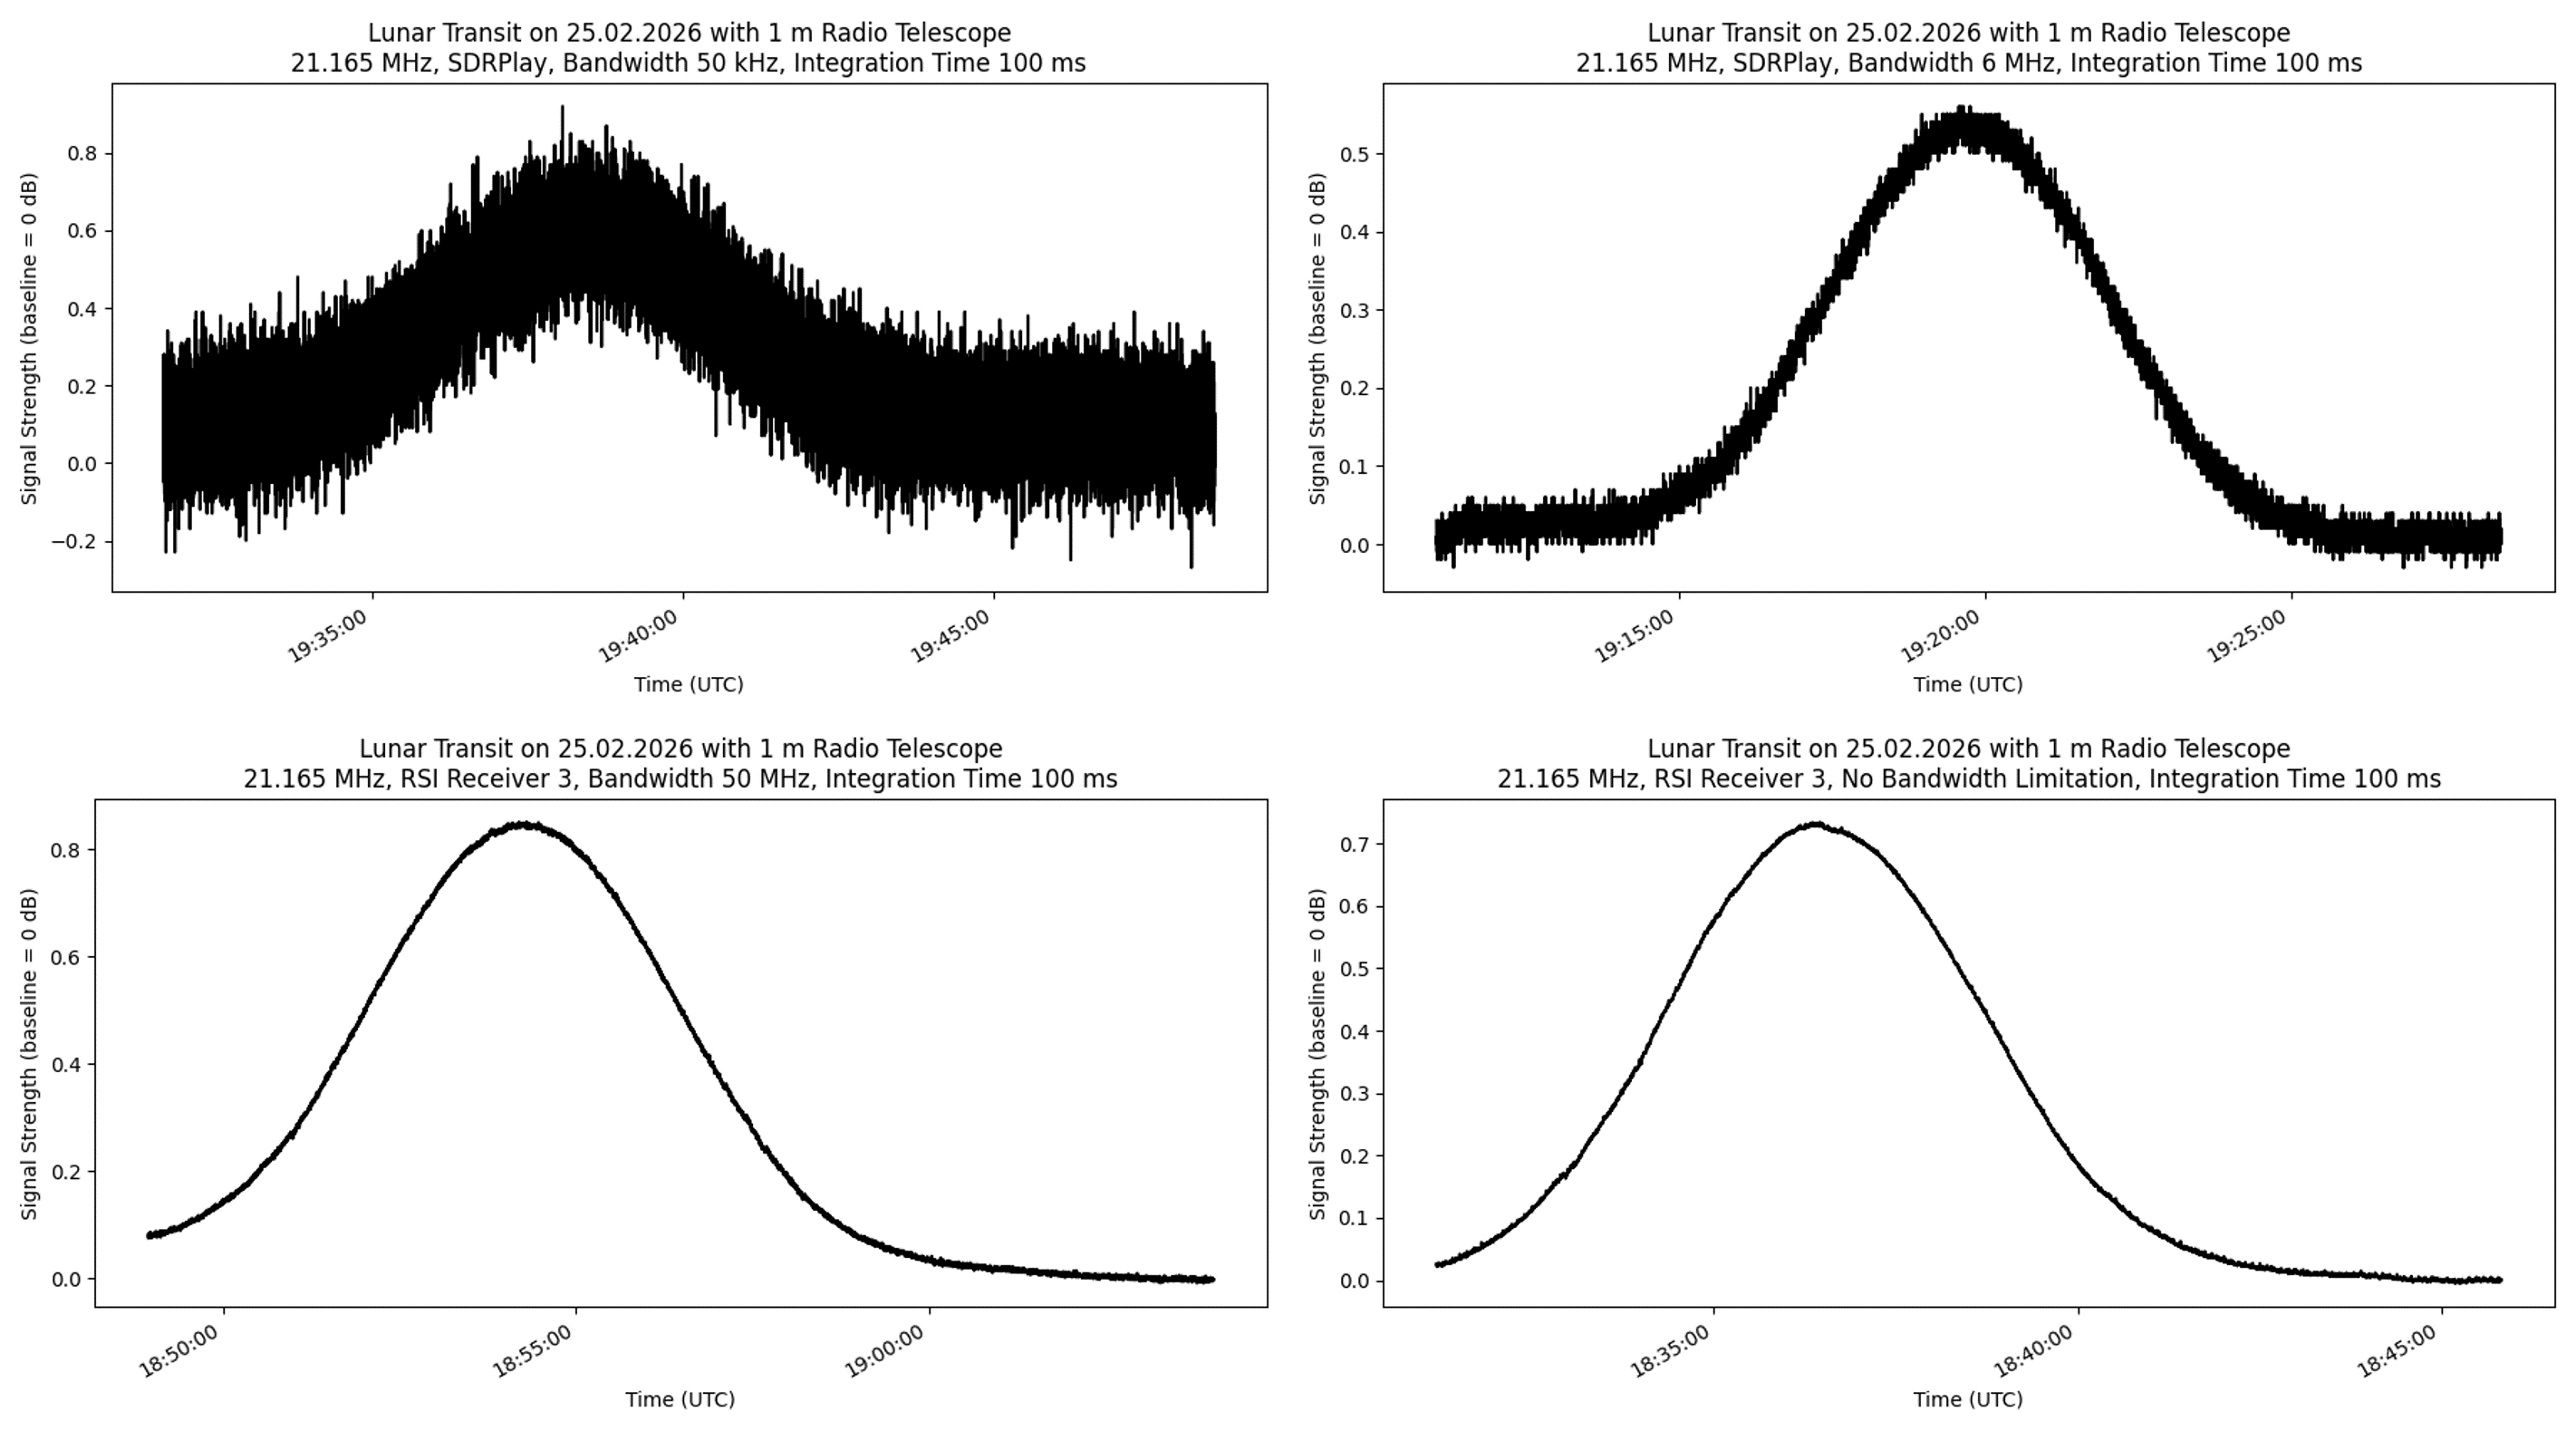
The figure again shows lunar transits observed with a 1-meter dish in the Ka-band. In contrast to the previous experiment, the integration time was kept constant at 100 ms, while the receiver bandwidth was varied:
- 50 kHz (SDRplay)
- 6 MHz (SDRplay)
- 50 MHz (RSI Receiver)
- Full bandwidth (RSI Receiver, no band limitation)
A clear trend can be observed:
- The noise level decreases significantly with increasing bandwidth.
- The maximum signal increase relative to the baseline remains unchanged.
This behavior is fully consistent with the radiometer equation. Increasing the bandwidth does not increase the signal itself, but it reduces the noise through improved statistical averaging. As a result, the lunar signal becomes progressively clearer and better defined.
Interestingly, the difference in noise reduction between 50 MHz and full bandwidth is no longer very pronounced. This indicates that, in this observing setup, a bandwidth of approximately 50 MHz is already sufficient to achieve a substantial improvement in signal-to-noise ratio.
In summary, this experiment shows:
- Larger bandwidth leads to lower noise and improved detectability.
- The signal amplitude itself remains constant.
- There are diminishing returns beyond a certain bandwidth.
This highlights once again the central role of bandwidth in continuum radio astronomy, especially when using simple broadband detector systems such as the Second Receiver.
Experiment 6: Effect of Bandwidth in the Ku-Band
This experiment illustrates the influence of receiver bandwidth under real-world interference conditions.
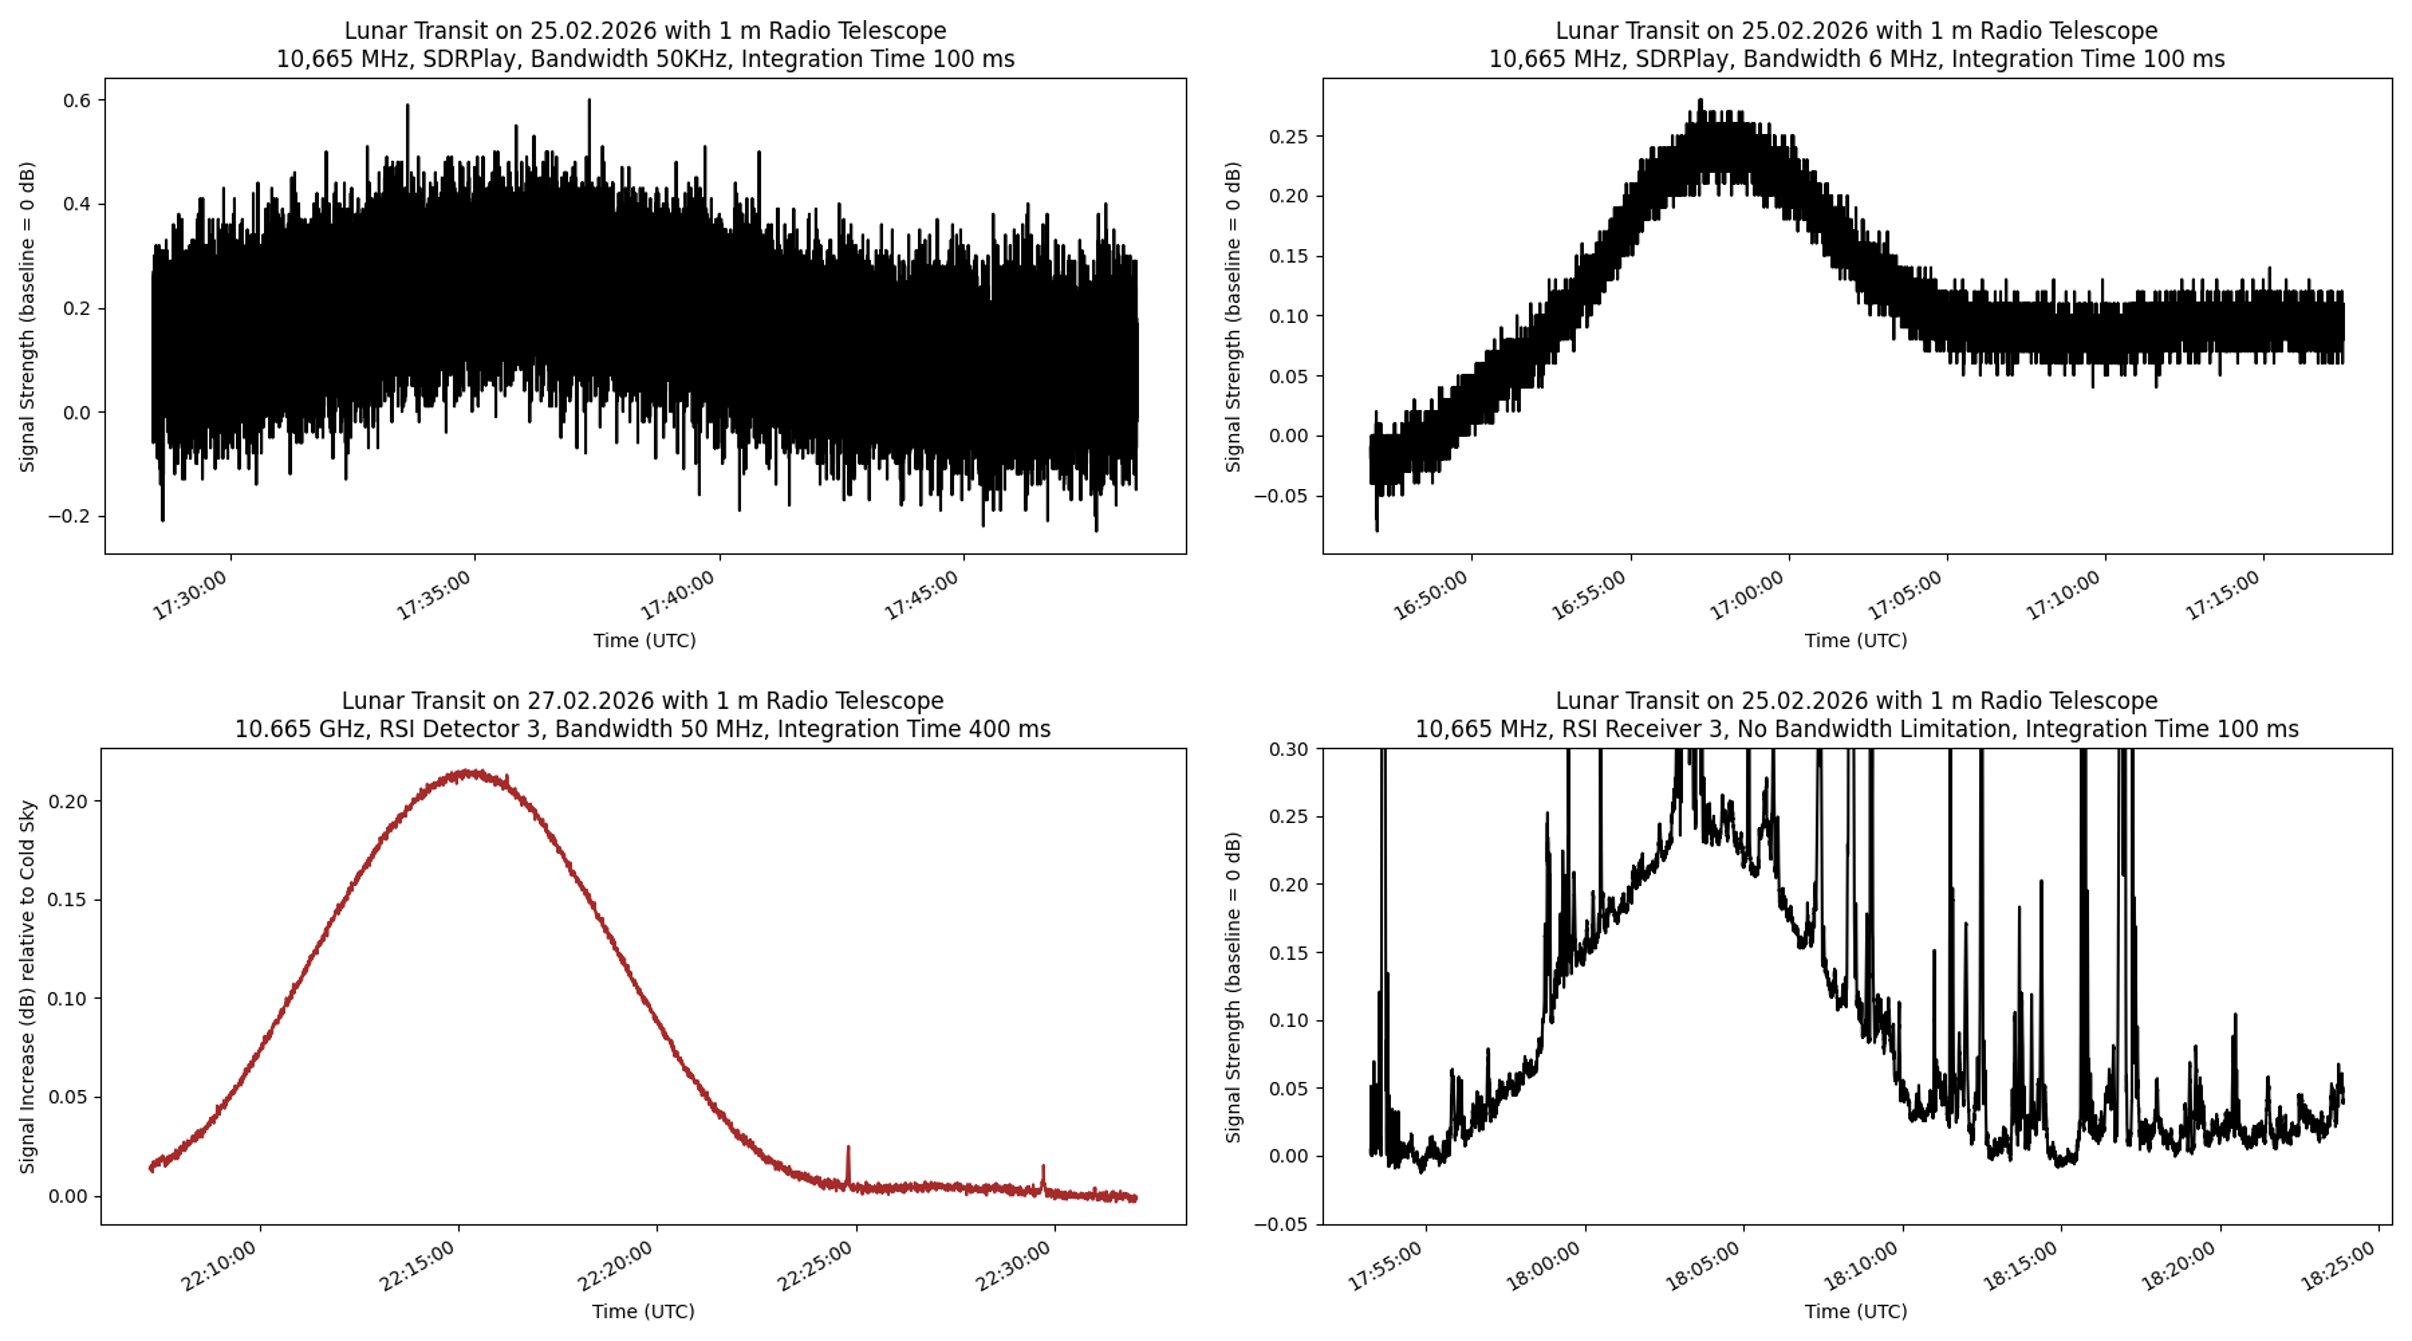
The figures again show a comparison of lunar transits observed with a 1-meter dish, this time in the Ku-band (10.665 GHz). The integration time was kept constant at 100 ms, while the receiver bandwidth was varied:
- 50 kHz (SDRplay)
- 6 MHz (SDRplay)
- 50 MHz (RSI Receiver)
- Full bandwidth (RSI Receiver, no band limitation)
The results clearly demonstrate several important effects:
- At 50 kHz bandwidth, the lunar signal is almost completely buried in the noise and is barely detectable.
- At 6 MHz bandwidth, the signal begins to emerge but is still affected by significant noise.
- At 50 MHz bandwidth, the lunar signal appears very clean and well-defined. Only minor interference is visible — for example, two small Starlink signals with amplitudes of approximately 0.02 dB pass through the filter.
- At full bandwidth, the situation changes significantly: the lunar signal is strongly affected by interference from Starlink satellites, which dominate large parts of the measurement.
This experiment highlights an important practical limitation:
While increasing bandwidth reduces noise (as predicted by the radiometer equation), it can also increase the susceptibility to artificial radio frequency interference (RFI).
In summary:
- Larger bandwidth leads to better noise reduction and improved detectability.
- However, it also allows more unwanted signals (RFI) to enter the system.
- The optimal bandwidth is therefore always a trade-off between sensitivity and interference suppression.
This effect is particularly relevant in the Ku-band, where satellite constellations such as Starlink produce strong and frequent interference signals.
In the next section, you will see the results of observations of selected continuum sources.