Broadband Scan
SDRplay Broadband Spectrum Scanner
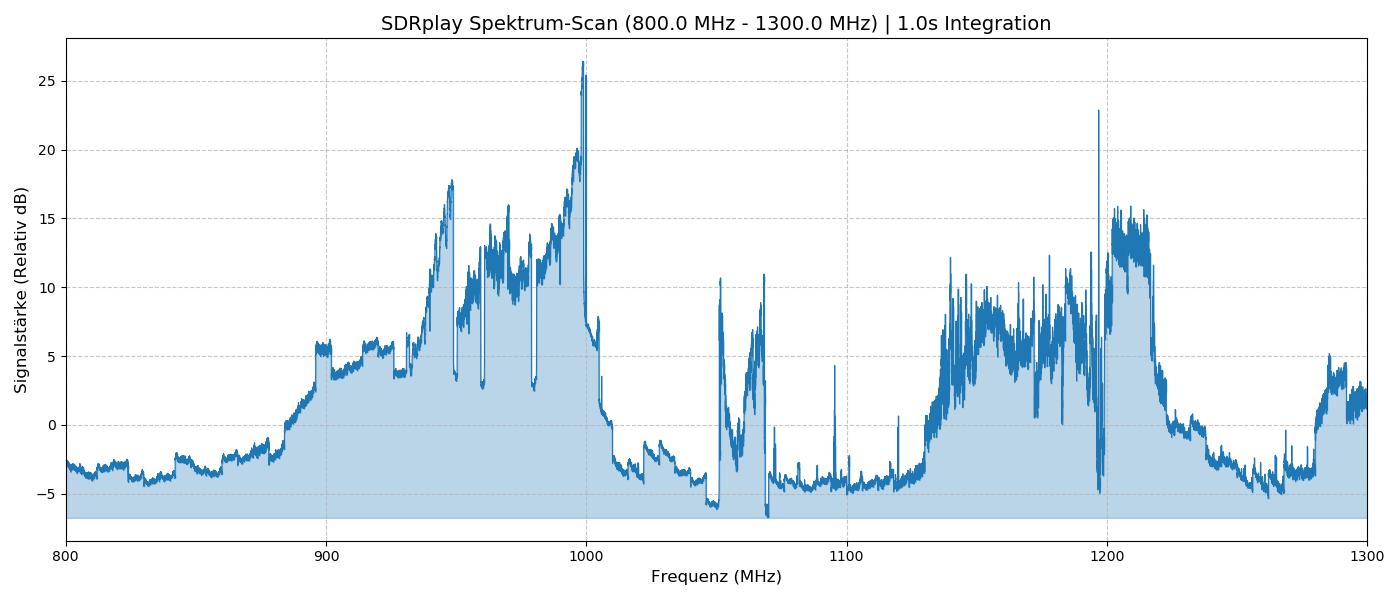
This program is designed to record and visualize radio frequency spectra over a very wide bandwidth, extending far beyond the instantaneous bandwidth limit of the SDR hardware. Its primary application is conducting site surveys to assess the Radio Frequency Interference (RFI) environment at a specific local site. By sweeping across vast frequency ranges, it allows users to identify noise floors, locate sources of continuous interference, and map the overall spectrum occupancy with high resolution.
System Requirements
To run this program successfully, the following hardware and software components are required:
- Hardware: An SDRplay receiver (e.g., RSP1A, RSPdx, RSPduo).
- Drivers: The official SDRplay API/drivers must be installed on the host system.
- Middleware: The SoapySDR framework and the specific SoapySDRPlay support module must be installed and properly linked.
- Python Environment: Python 3.x with the following packages:
numpy(for numerical operations and FFT calculations)matplotlib(for generating the spectrum plot)SoapySDR(Python bindings for the SoapySDR API)
How It Works
Since SDRplay devices typically have a maximum instantaneous bandwidth of 8 to 10 MHz, scanning hundreds of Megahertz requires a sequential approach.
The script divides the user-defined frequency range into smaller, overlapping chunks. For each chunk, the script tunes the SDR to the center frequency, pauses briefly to allow the Phase-Locked Loop (PLL) to lock and the hardware to stabilize, and then captures raw IQ samples.
Instead of taking a single snapshot, the program continuously captures and calculates the Fast Fourier Transform (FFT) for a user-defined integration time (e.g., 1 second). The linear power of these FFTs is accumulated and averaged. Once all segments are scanned, the script stitches the data together into a single, seamless array, converts the power to relative decibels (dB), and plots the full wideband spectrum.
Core Features
- Seamless Wideband Stitching: Automatically calculates frequency steps and stitches multiple hardware bandwidth blocks into one continuous spectrum.
- Hardware Artifact Correction: * Over-sampling and Cropping: Discards the edges of each FFT block (where filter roll-off occurs) to prevent sharp drops and ensure smooth transitions between stitched segments.
- DC Offset Removal: Identifies the Local Oscillator (LO) leakage spike in the center of each block and removes it via linear interpolation of the surrounding bins.
- Time Integration (Averaging): Averages multiple FFT frames over a set duration to significantly reduce noise variance, making weak continuous signals stand out from the noise floor.
- Manual Gain Control: Disables the hardware Automatic Gain Control (AGC) and uses a fixed, user-defined gain level. This prevents baseline shifts and step-artifacts between different segments, ensuring accurate relative signal strength comparisons across the entire scan.
- Data Smoothing: Applies an optional moving average filter to the final stitched data to visually smooth the spectrum and reduce high-frequency noise in the plot.
- Dual-Axis Visualization: Allows the user to input a Local Oscillator (LO) frequency (e.g., if using an upconverter/downconverter) and displays a secondary X-axis showing the offset relative to that LO.