Broadband Detector
About This Page
This page describes the technical design and functionality of the Second Receiver, a low-cost broadband detector developed for observing weak continuum sources in amateur radio astronomy.
If you are interested in the practical application of this system, including real observation results obtained with small satellite TV dishes, please refer to the following pages:
- Small Experiments – simple and reproducible setups demonstrating key principles
- Observation Objects – overview of observed radio sources
Specific examples include:
These pages illustrate how the Second Receiver can be used in practice and what kinds of results can be achieved with relatively simple and affordable equipment.
Overview
In radio astronomy, there are two principal approaches to signal processing: analog and digital. Each method has its own strengths and limitations, particularly for amateur radio astronomers working with limited budgets.
Digital signal processing (DSP) converts analog signals into digital data that can be analyzed and processed by software. This approach is highly flexible and allows sophisticated post-processing techniques. Software-defined radios (SDRs) are the most common implementation of this concept and have become increasingly popular in recent years.
However, SDRs also have an important limitation: bandwidth. Affordable SDR systems typically process only a few megahertz at a time. Achieving larger bandwidths requires expensive high-end hardware and powerful computers capable of handling the increased data rate.
In contrast, simple broadband detectors — such as logarithmic or true power detectors — offer a fundamentally different approach. Their main advantage lies in their ability to process very wide bandwidths, often several hundred megahertz, with minimal hardware complexity.
Sensitivity and the Radiometer Equation
The performance of a radio telescope is governed by the radiometer equation, which shows that sensitivity depends on four main parameters:
- the antenna aperture
- the system temperature
- the receiver bandwidth
- the integration time
In amateur radio astronomy, antenna size is usually limited by cost and space, and system temperature can only be improved to a certain extent. Integration time can be increased, but only with diminishing returns due to the square-root relationship.
This leaves bandwidth as the most effective parameter for improving sensitivity. A wider bandwidth reduces noise and makes weak signals more detectable — a crucial advantage when observing faint continuum sources such as supernova remnants.
To illustrate the challenge: the flux density of Taurus A in the Ku-band is roughly 100 times lower than that of the Moon, and the Moon itself is about 100 times weaker than the Sun. Detecting such weak sources requires careful optimization of the receiving system.
Advantages for Amateur Radio Astronomy
Amateur radio astronomers benefit from two important circumstances. First, the Ku-band — widely used for satellite TV — provides access to low-cost hardware. Satellite dishes and LNBs are readily available and often even free. Modern LNBs operating around 11 GHz offer excellent noise performance, making them well suited for sensitive measurements.
Second, certain sources such as supernova remnants exhibit relatively flat spectral behavior, meaning their flux density does not decrease as rapidly with increasing frequency as many other sources do. This allows objects like Taurus A to remain detectable even at Ku-band frequencies.
Introduction: The “Second Receiver”
The broadband detector described here is called the “Second Receiver”, a name that originated somewhat humorously. The first prototype, based on a simple logarithmic detector, enabled the first successful observation of the Moon with a 1-meter dish. Although the design was rather improvised, it worked surprisingly well and was therefore nicknamed the “First Receiver.”
The current design builds upon extensive experimentation and incorporates numerous improvements. Different detector modules, ADC configurations, and microcontrollers were tested. The system was evaluated with and without filtering, with different shielding approaches, and under real observing conditions. The result is a significantly more robust and sensitive instrument.
System Architecture
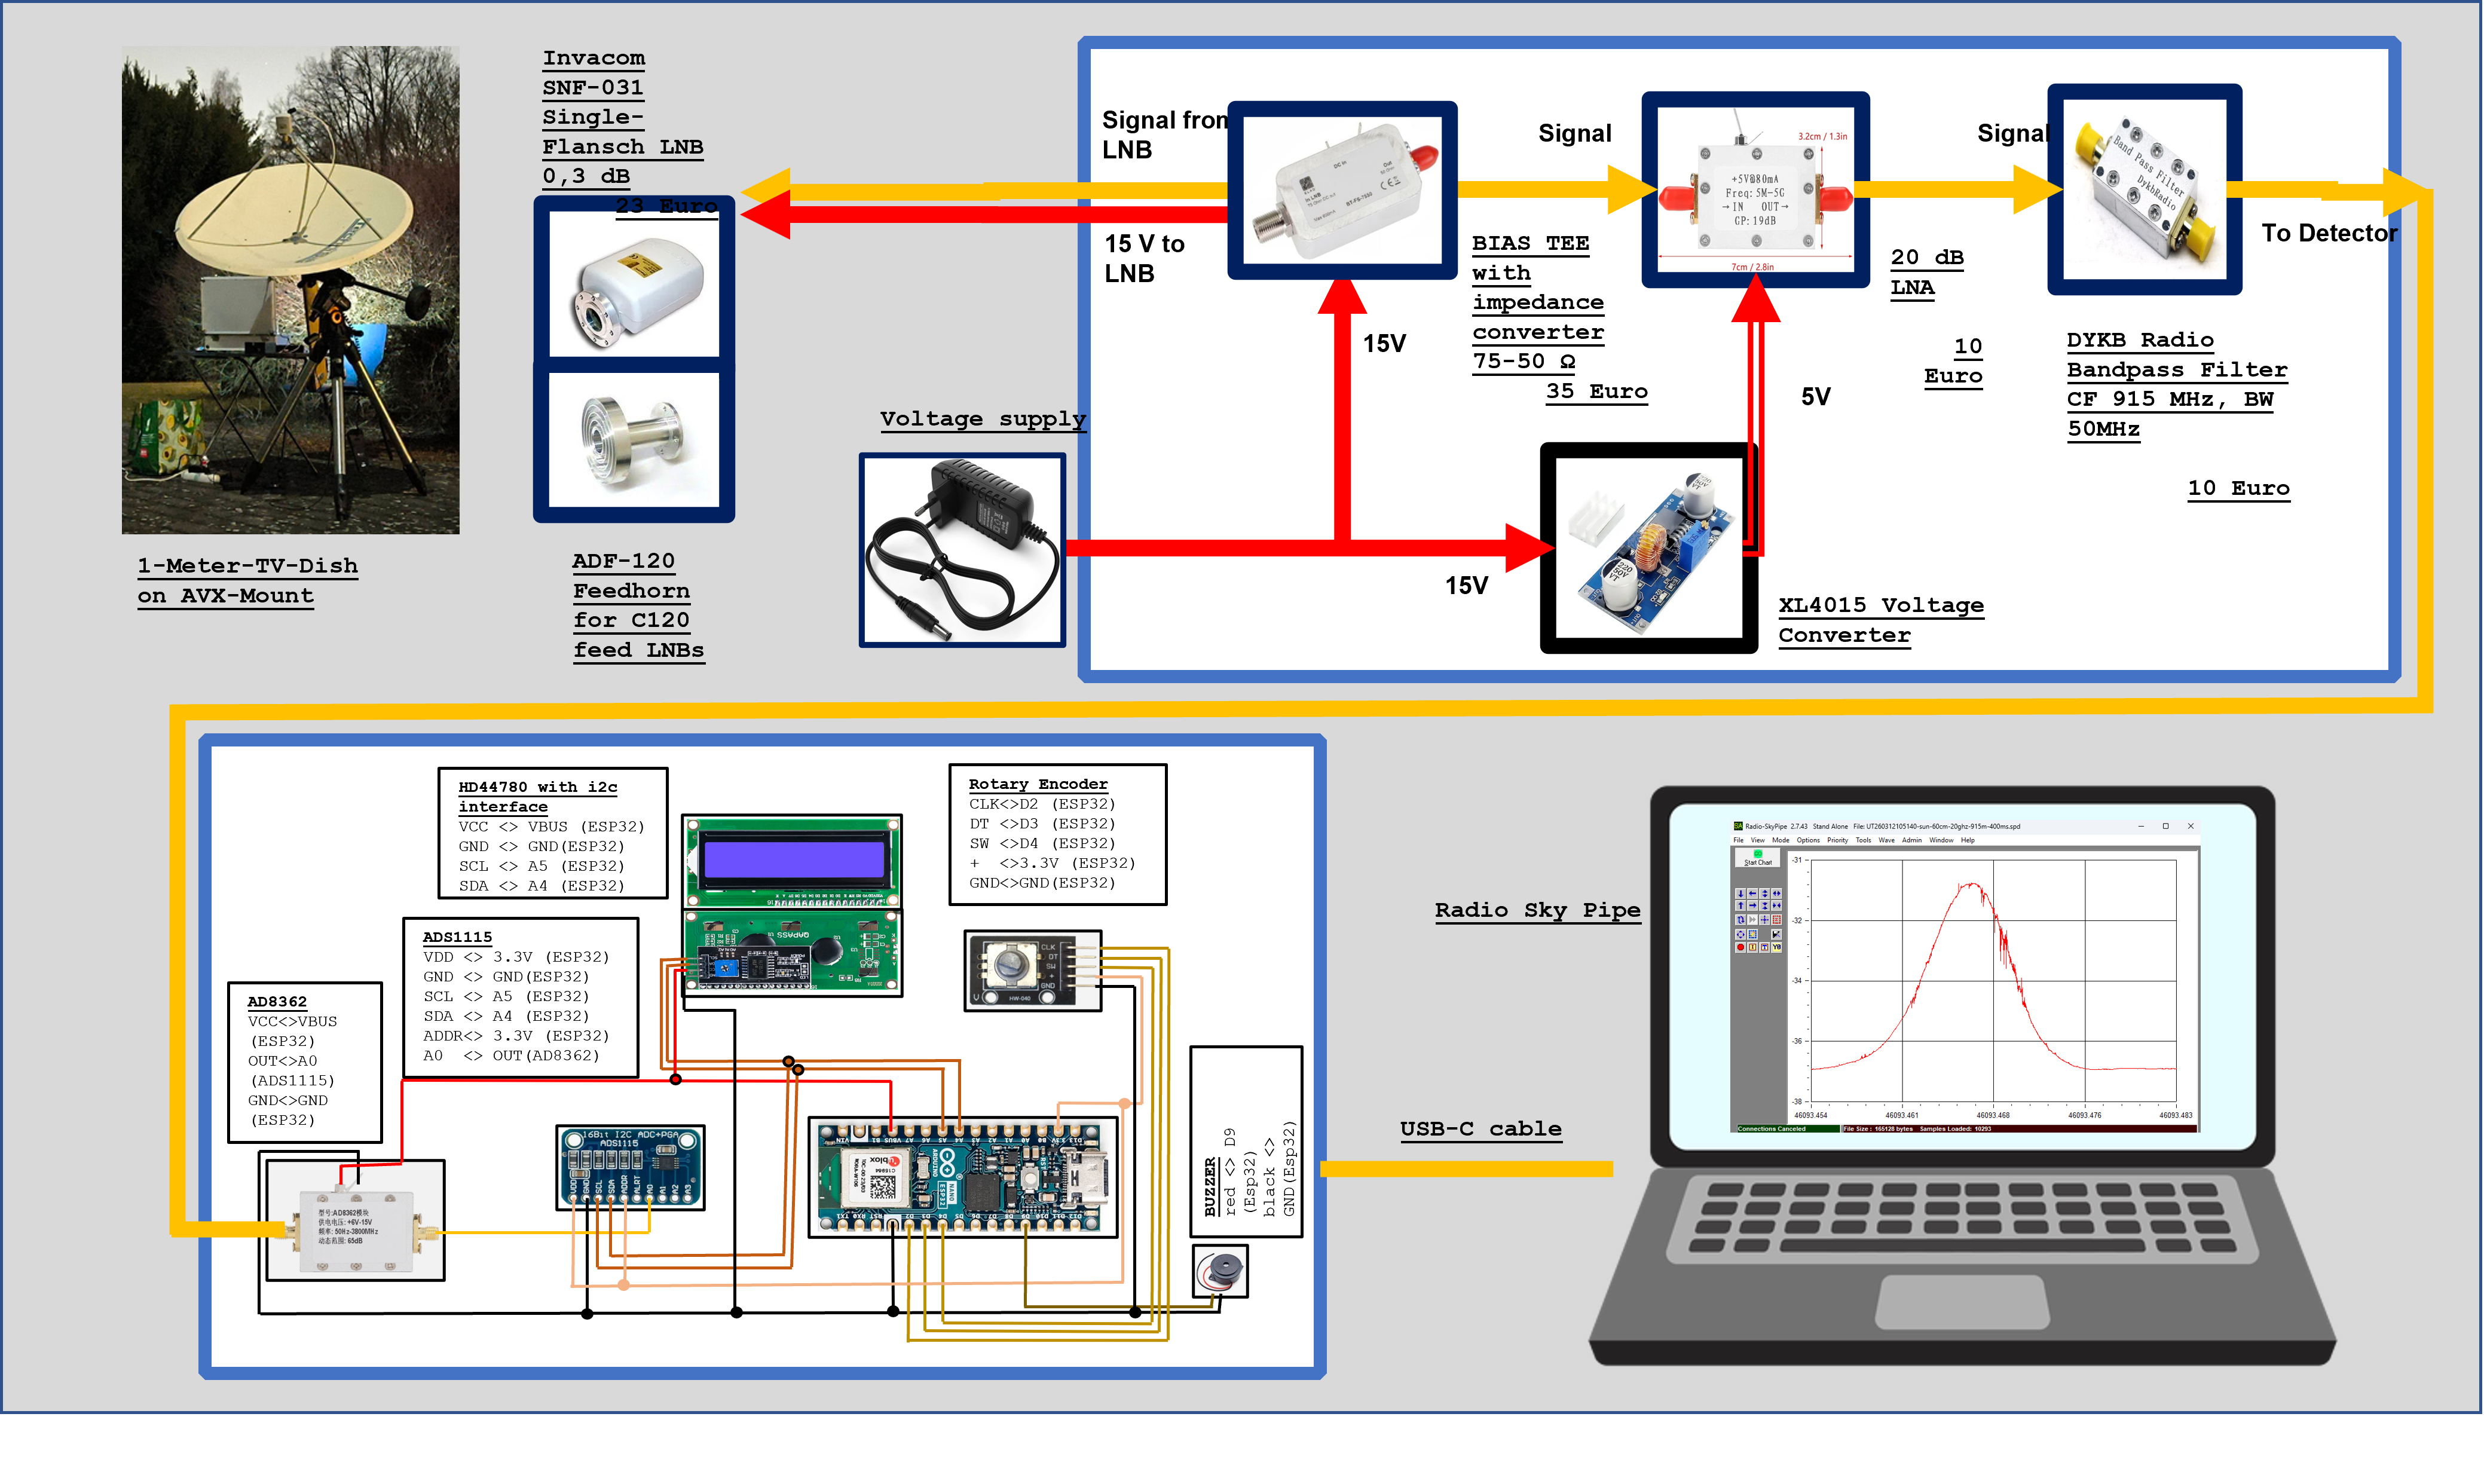
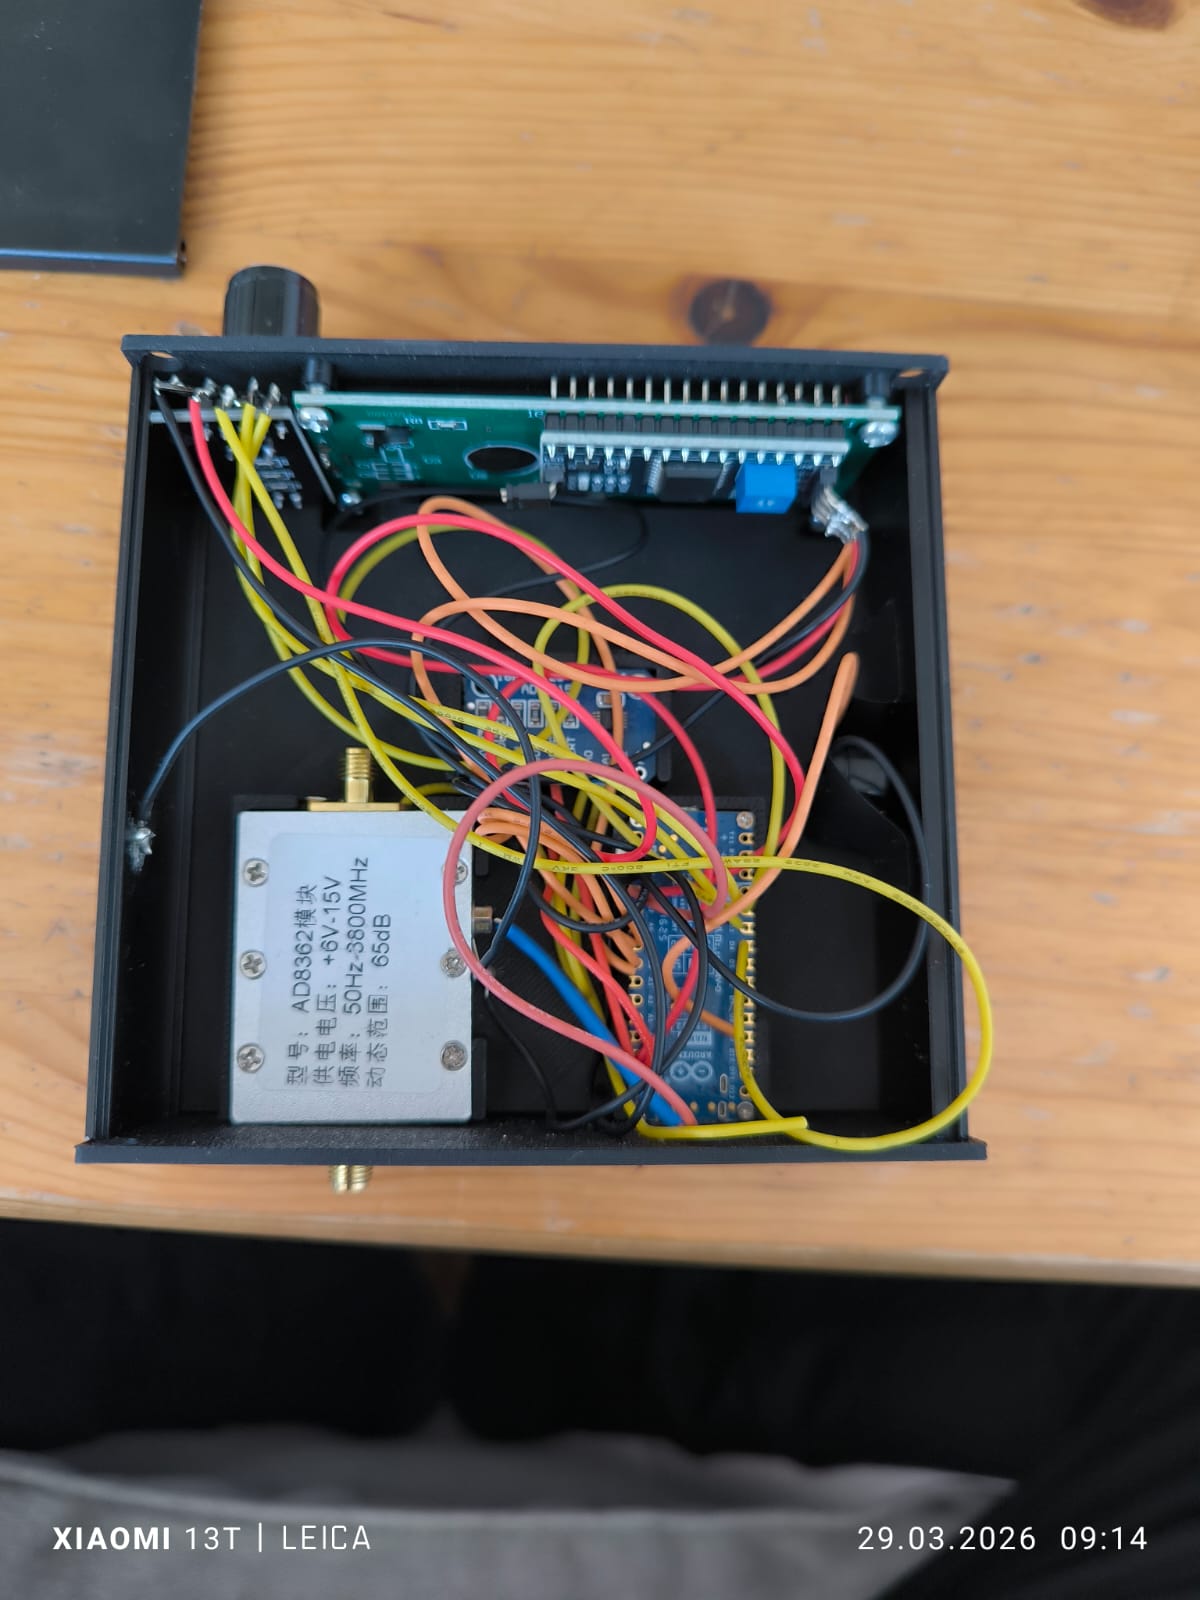
At the heart of the system is the AD8362 true power detector, combined with a 16-bit ADS1115 ADC and either an Arduino or an ESP32 microcontroller.
The AD8362 proved to be the best choice among several tested detectors. Unlike logarithmic detectors such as the AD8317, it provides a non-inverted output and includes an integrated amplifier. It can measure signals over a wide dynamic range and offers a relatively steep output slope of about 51 mV/dB, which improves sensitivity.
Because the AD8362 already includes amplification, the overall system can be kept simple and compact. This reduces susceptibility to interference and increases reliability — both important factors in radio astronomy.
Mechanical Design and Shielding
There are two versions of the AD8362: With and without metal enclosure. The version with metal enclosure should be used. Additional all other components of the detector should also housed in a metal box, which is essential for stable operation.
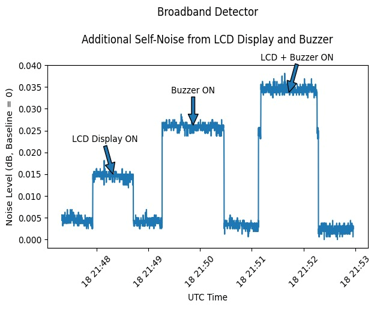
Without shielding, significantly higher noise levels were observed, partly caused by interference from nearby electronics such as displays or microcontrollers. With proper shielding, these effects are largely suppressed, resulting in a much cleaner signal.
Signal Processing and Integration
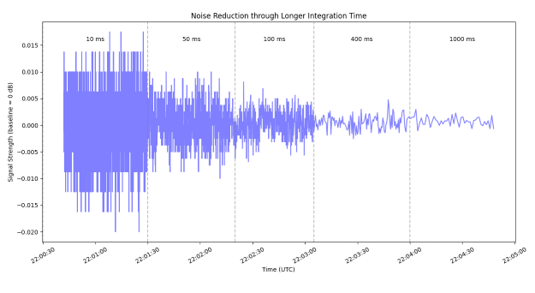
The output signal from the detector is digitized by the ADS1115 and processed by the microcontroller. The system continuously samples the signal and applies a moving average over a configurable time interval.
The integration time can be adjusted between 10 ms and 1000 ms using a rotary encoder. Increasing the integration time reduces noise and improves the visibility of weak signals, in accordance with the radiometer equation.
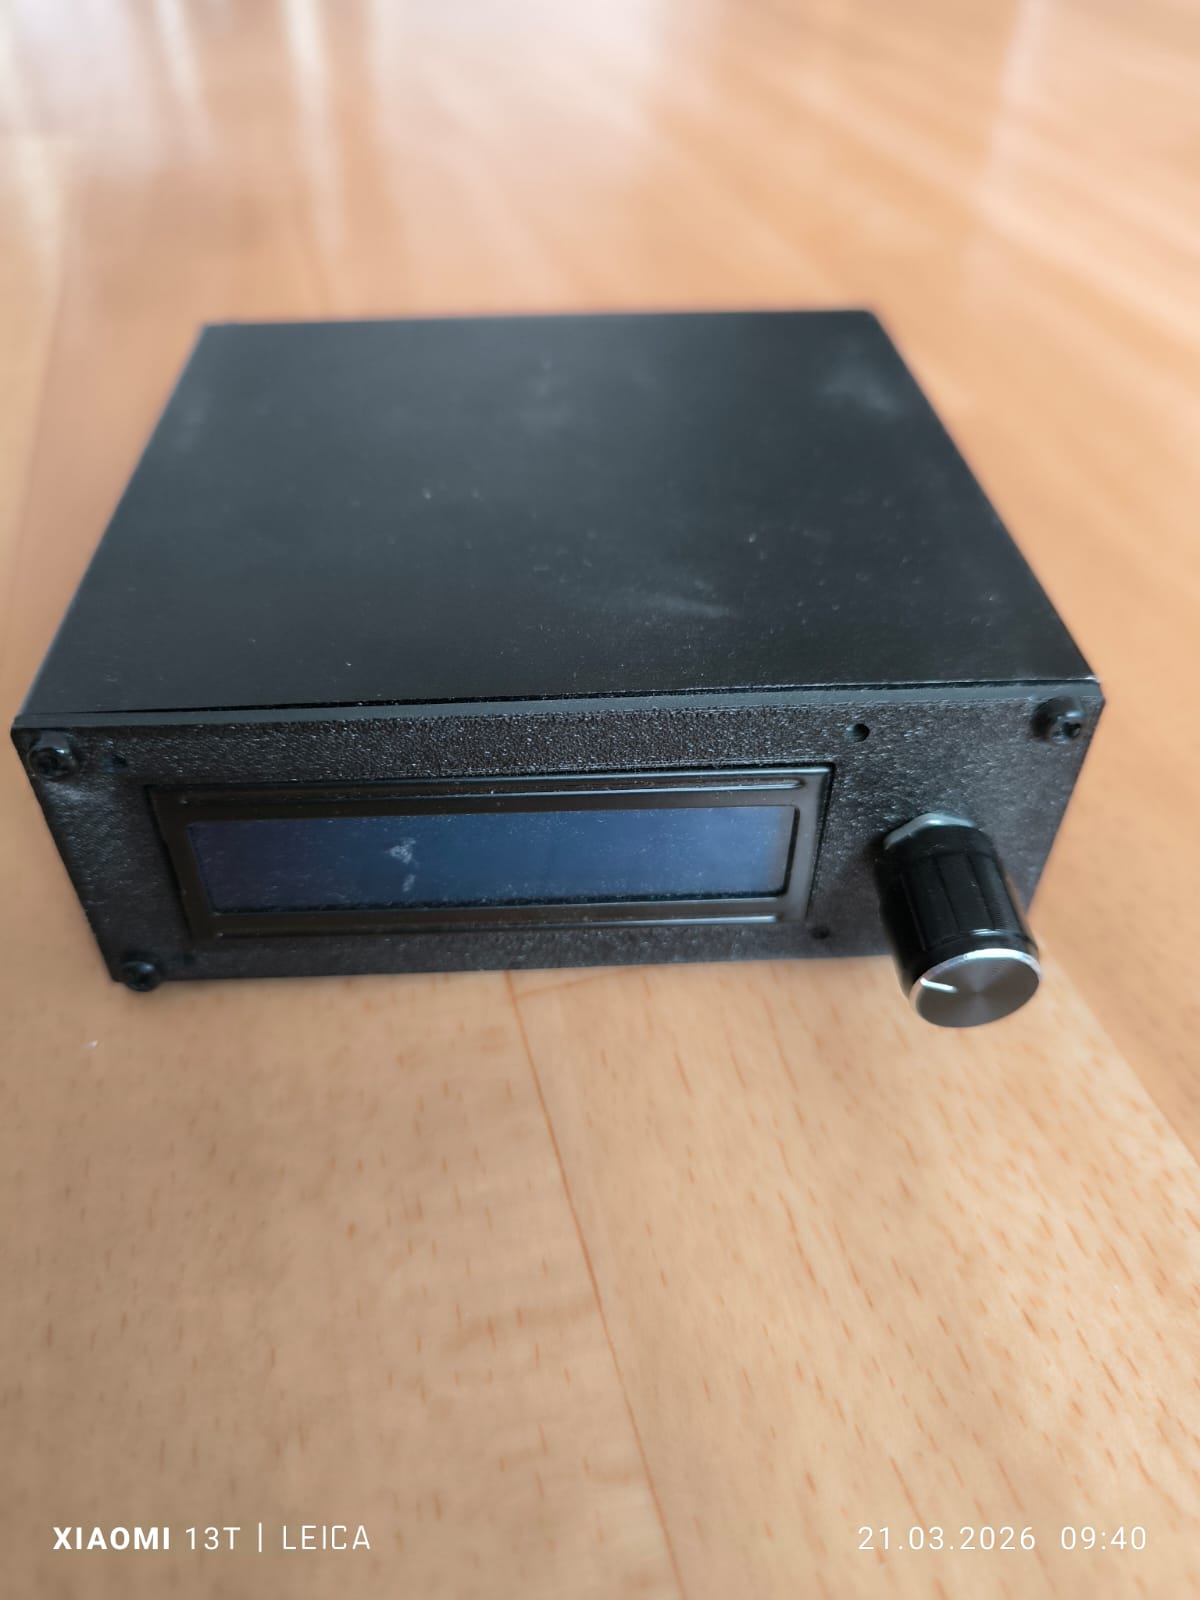
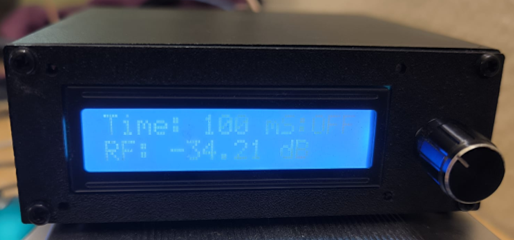
Additional features include a small LCD display showing signal strength in dBm, as well as a buzzer that converts signal variations into sound. This has proven particularly useful for aligning the antenna with strong sources such as the Sun.
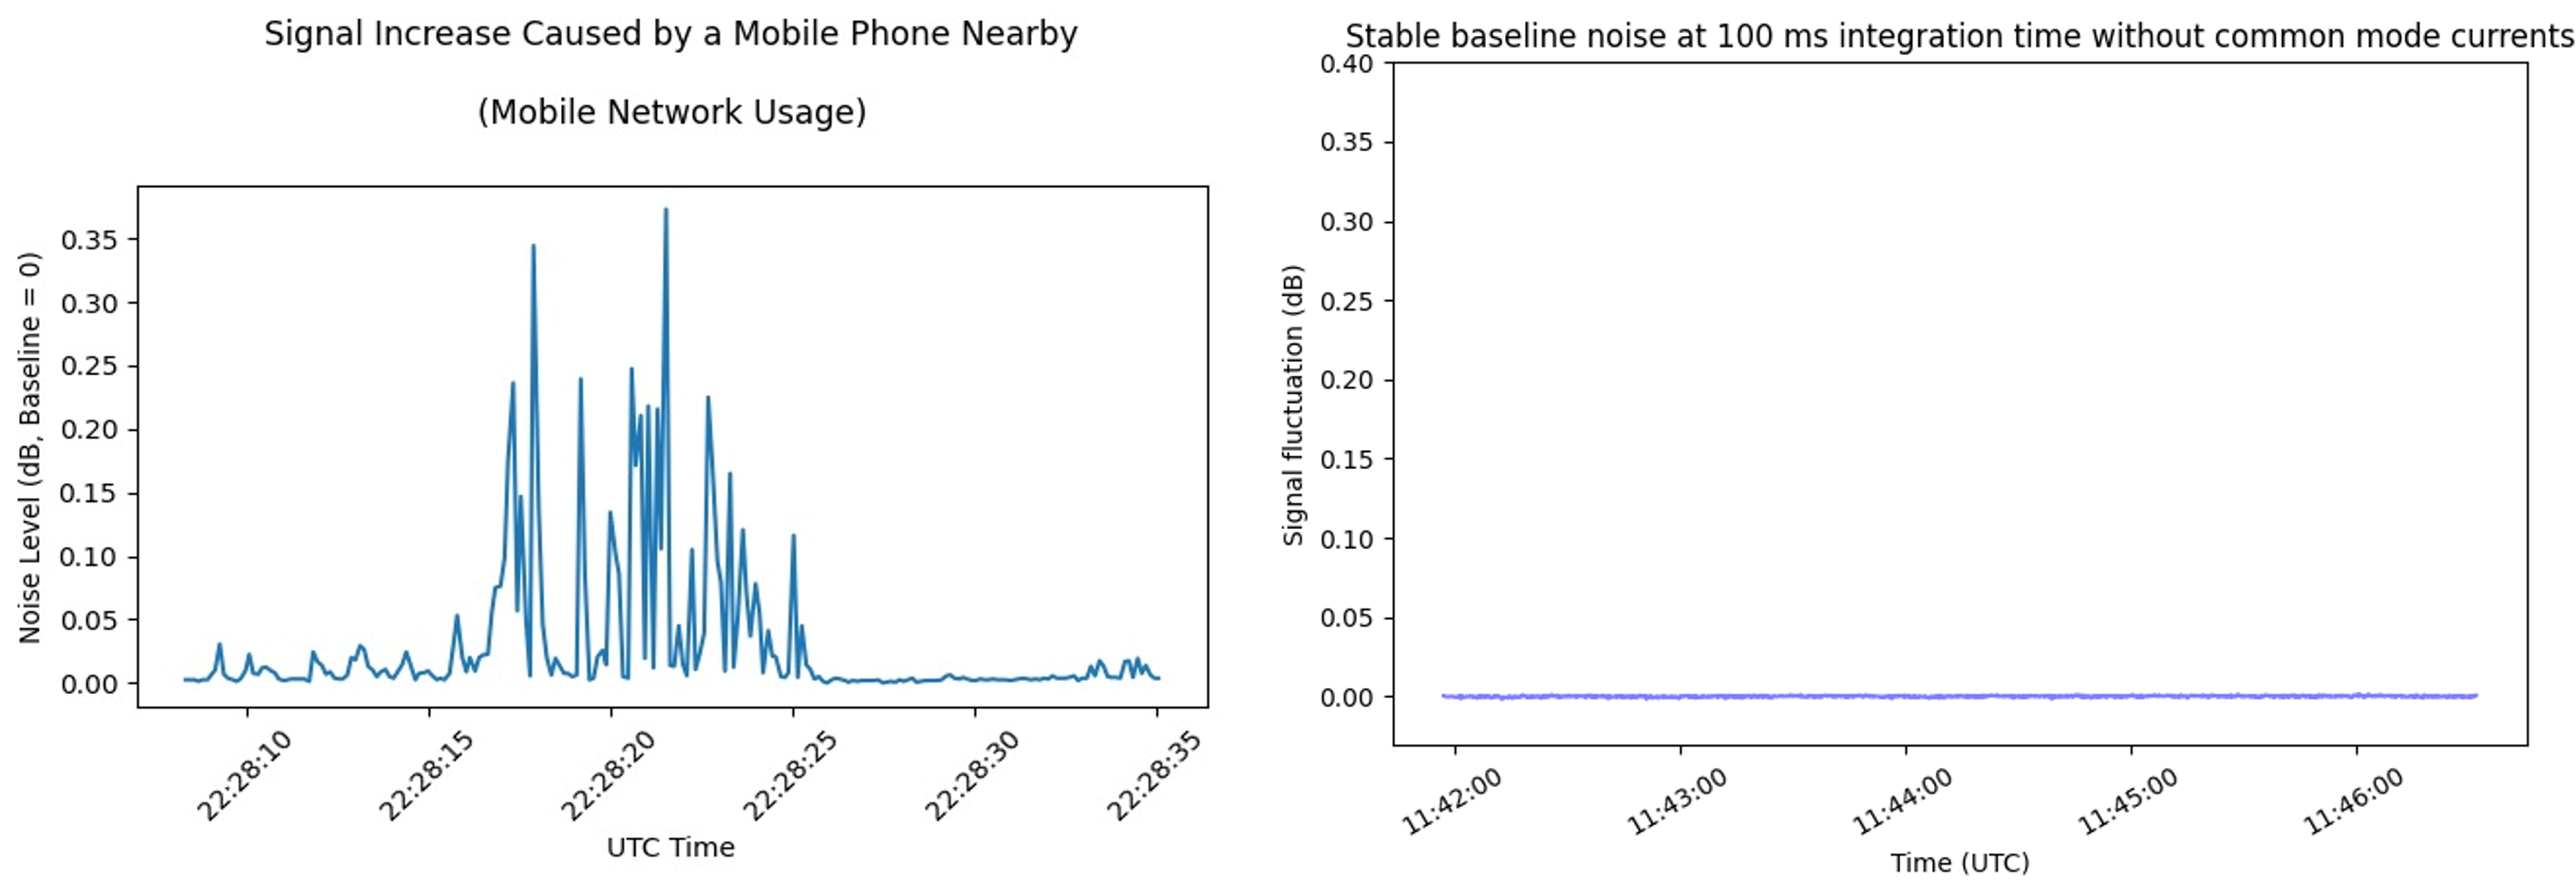
Mitigation of Common-Mode Currents
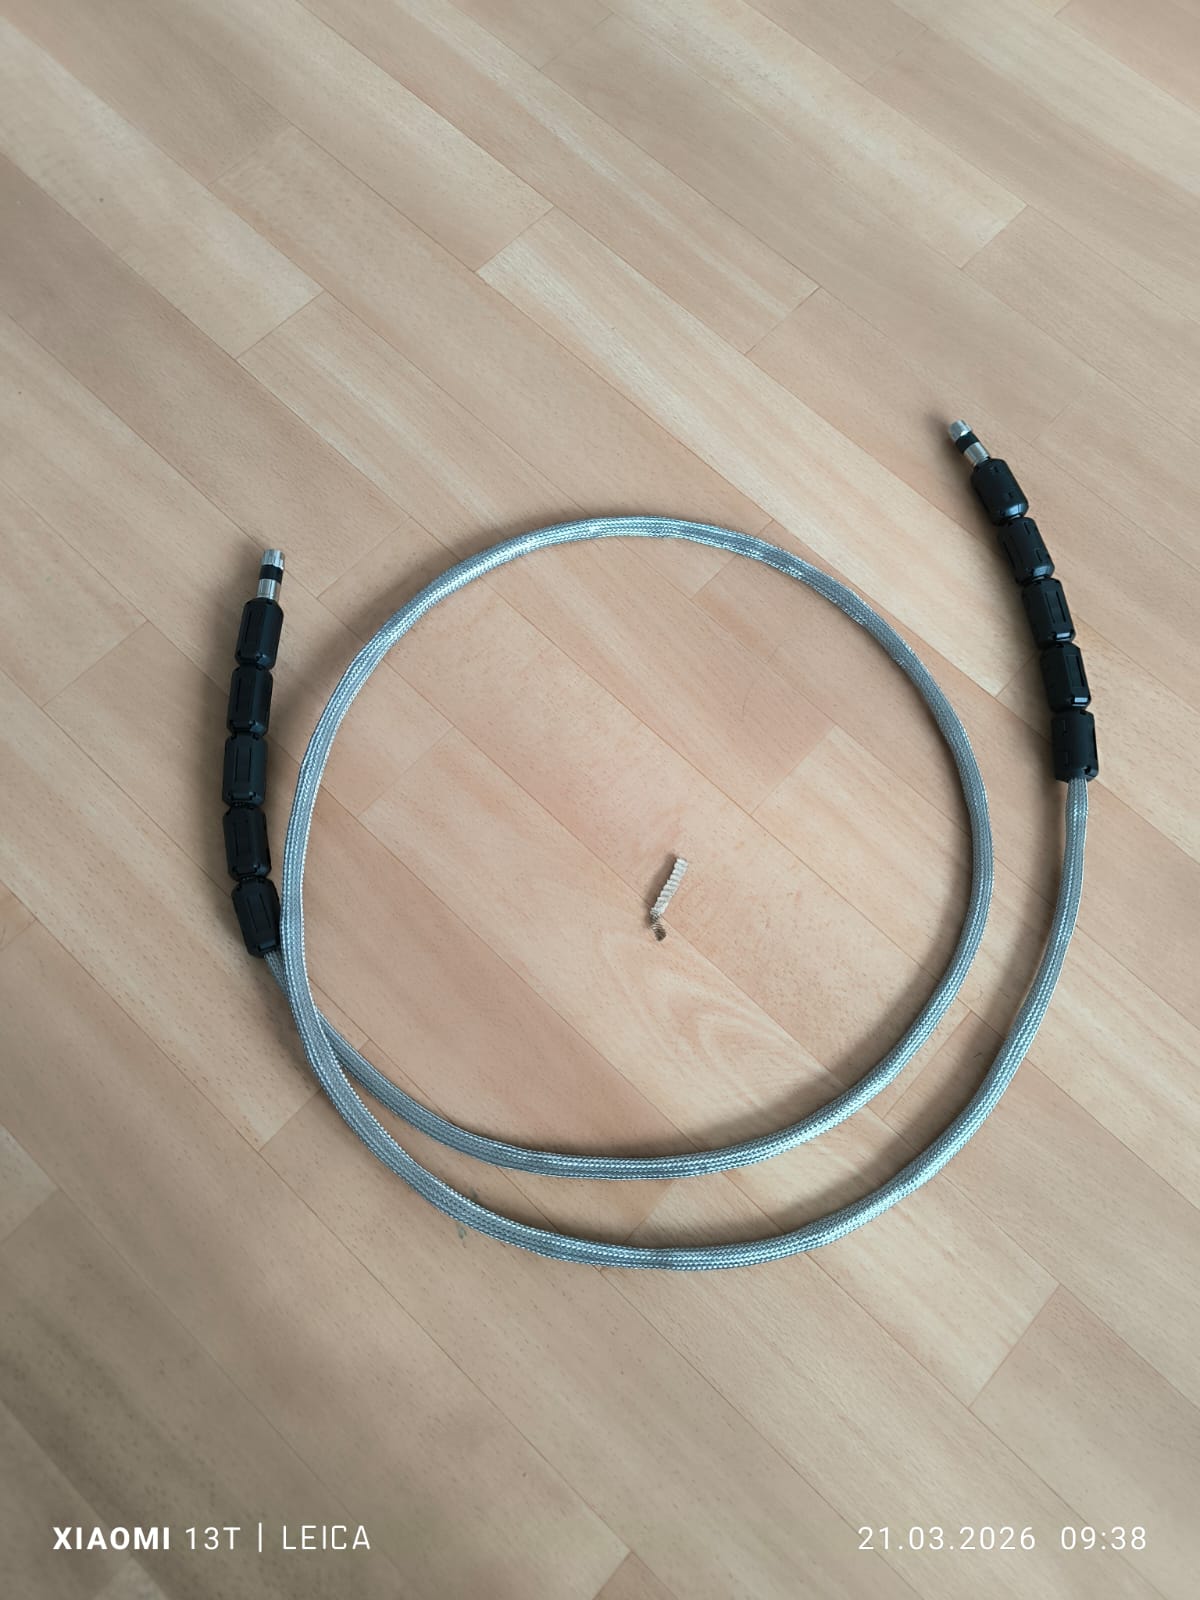
One of the major practical challenges was unwanted signal pickup via common-mode currents on the coaxial cable. This effect becomes more pronounced at large bandwidths, where external interference can easily enter the system.
Several measures were implemented to address this: proper grounding, removal of unnecessary cable loops, the addition of multiple ferrite cores, and the use of high-quality quadruple-shielded coaxial cable.
Among these, the improved coaxial cable had the most significant impact. After these modifications, the system became stable and largely immune to such interference.
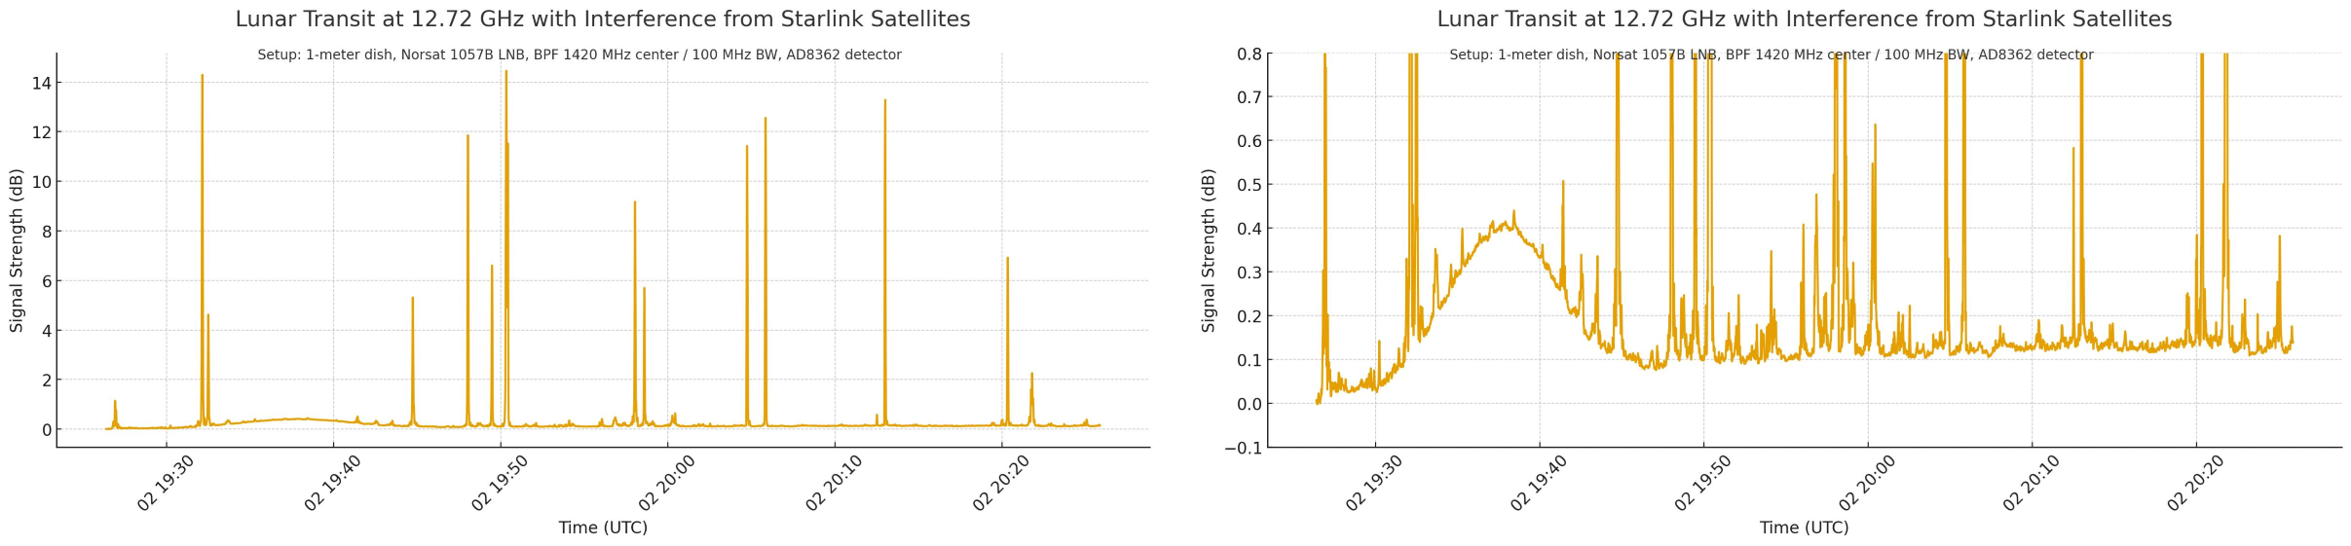
Starlink Interference in the Ku-Band
A major limitation in the Ku-band is interference from Starlink satellites, which produce strong transient signals when crossing the antenna beam. These signals can exceed the desired astronomical signal by orders of magnitude.
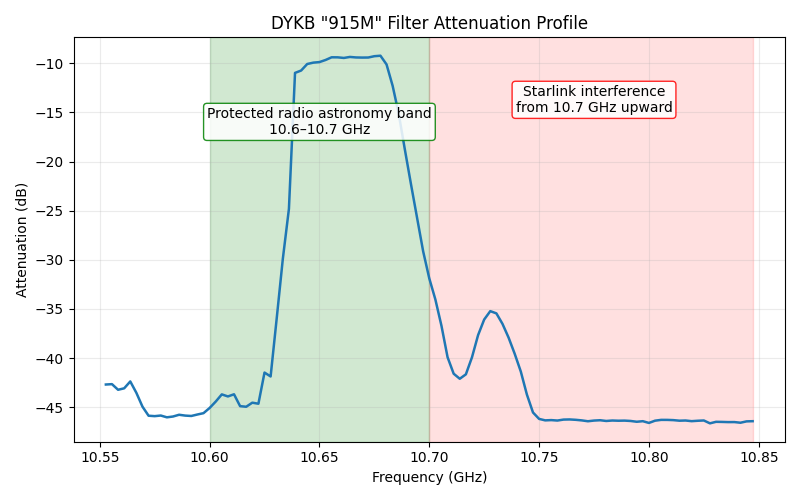
To mitigate this, a bandpass filter was introduced, restricting the bandwidth to about 50 MHz just below the Starlink frequency range. We tested a number of filters, and a low-cost unit from China priced at around €14 turned out to work surprisingly well. It is sold as the “DYKBRadio Bandpass Filter 915M”. The filter has a center frequency of 915 MHz and a bandwidth of approximately 50 MHz.
Why are these parameters particularly suitable? Most commercial LNBs use a local oscillator (LO) frequency of 9.75 GHz. This means that a signal at 915 MHz is downconverted from:
915 MHz + 9750 MHz = 10.665 GHz
With a bandwidth of 50 MHz, the resulting frequency range falls just below the region heavily affected by Starlink transmissions. At the same time, it is well centered within the 100 MHz band (10.6–10.7 GHz) that is internationally allocated to radio astronomy.
In contrast, the Ka-band is largely free from such interference, allowing the full receiver bandwidth to be used and further improving sensitivity.
Software and Data Processing
The microcontroller software is designed to be simple and efficient. It continuously samples data, stores it in a ring buffer, and computes a moving average. The integration time can be adjusted in real time using a rotary encoder.
Software
The Second Receiver can be operated with two different software solutions.
Radio SkyPipe
The system is fully compatible with Radio SkyPipe, a proprietary software package for displaying total power measurements in radio astronomy.
Radio SkyPipe is one of the most advanced and widely used tools in amateur radio astronomy. It offers a rich set of features, including:
- real-time visualization of signal strength
- long-term data recording
- flexible scaling and analysis tools
It is particularly well suited for continuous monitoring and standardized observations.
Continuum 1.0 (Python Software)
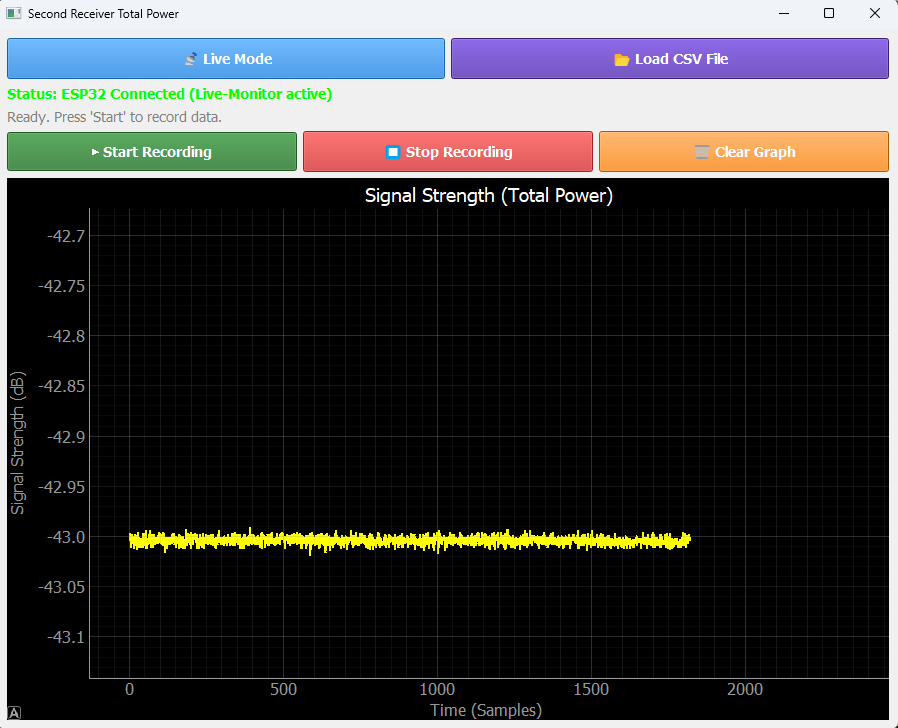
Alternatively, the Second Receiver can be operated with a custom-developed software called “Continuum 1.0”.
This is a Python-based program that provides all essential functions for data acquisition, visualization, and analsis.
Update: The software has been updated with new features and is now called “Continuum SR”
Setup
- The program code requires the correct COM port of the receiver to be specified
- Once configured, the system can be operated in two main modes
Live Mode
In live mode, the program displays the current signal strength as a continuously updated graph.
Features include:
- Interactive navigation using the mouse
- Zoom in and out
- Pan across the graph
- Zoom in and out
- A reset button to restart the plot
- A record button to start data acquisition
During recording, the data are stored as CSV files in the program directory, including:
- timestamp
- signal strength
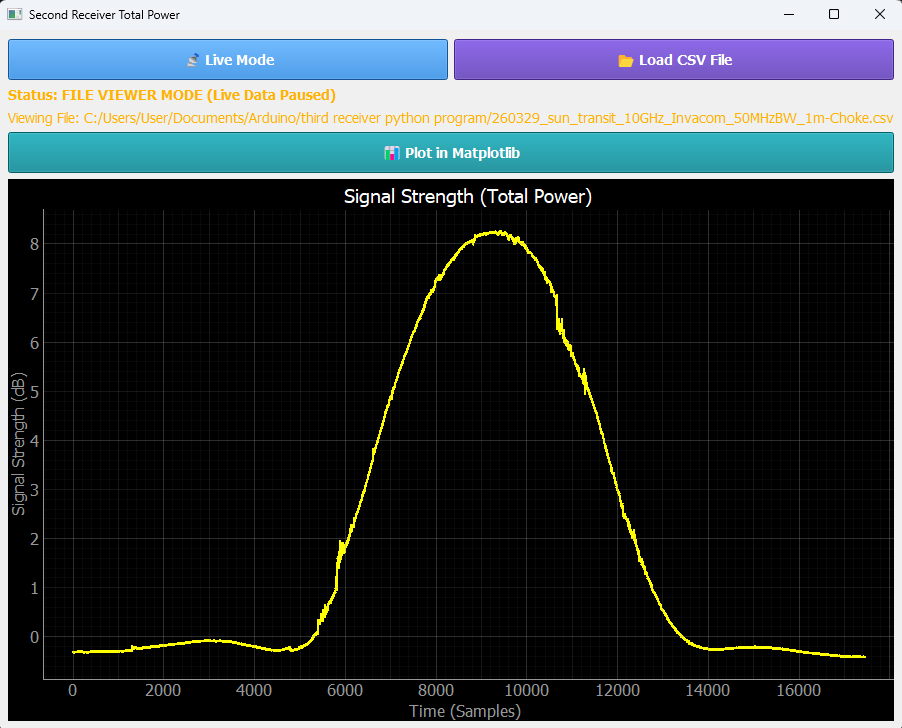
Data Analysis Mode
In the second mode, previously recorded data can be loaded and analyzed.
- CSV files can be opened and displayed directly
- A button labeled “Plot in Matplotlib” allows scientific visualization
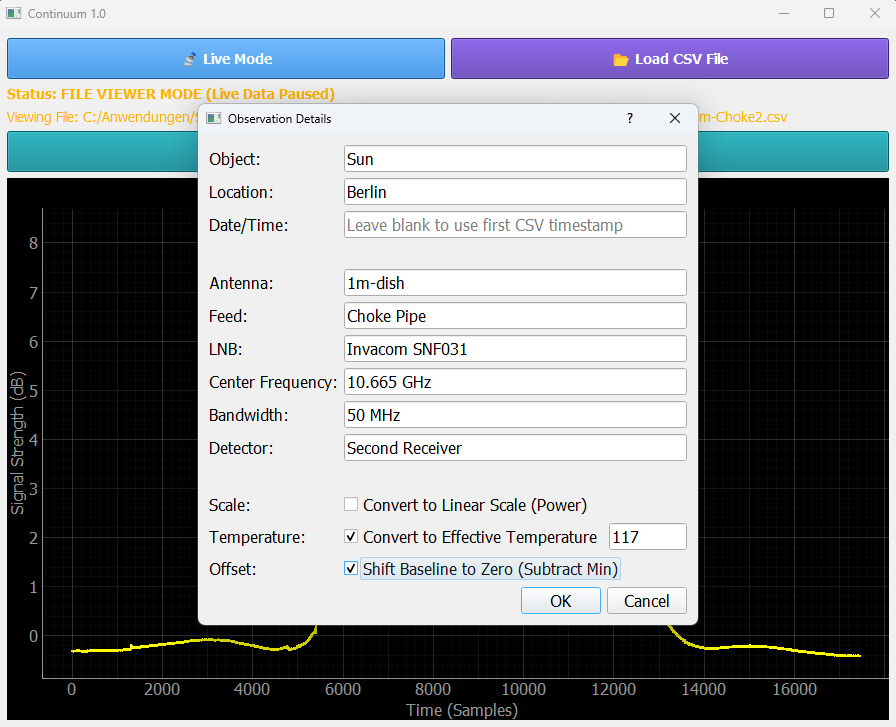
When this function is selected, a form appears where measurement parameters can be entered, such as:
- date and time
- antenna type
- feed
- LNB
- and other relevant metadata
These parameters are then included in the final plot.
Plotting Features
The plotting interface offers additional options:
- a checkbox to convert the logarithmic scaling of the second receiver to linear scaling
- a checkbox to convert the scaling of the y-axis to effective temperature. To do this, the system temperature of the radio telescope must be entered.
- A checkbox to apply an offset, aligning the baseline to zero
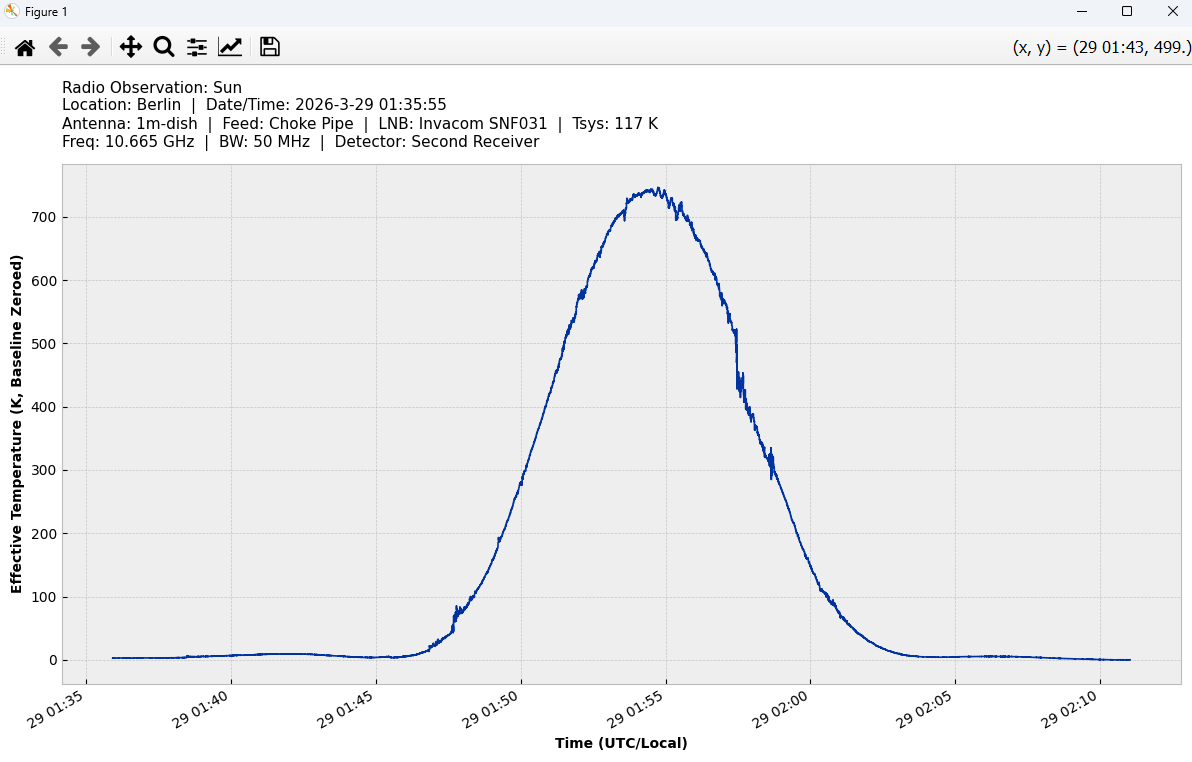
- Generation of publication-quality plots using Matplotlib
- Export and saving of the resulting figure as an image file
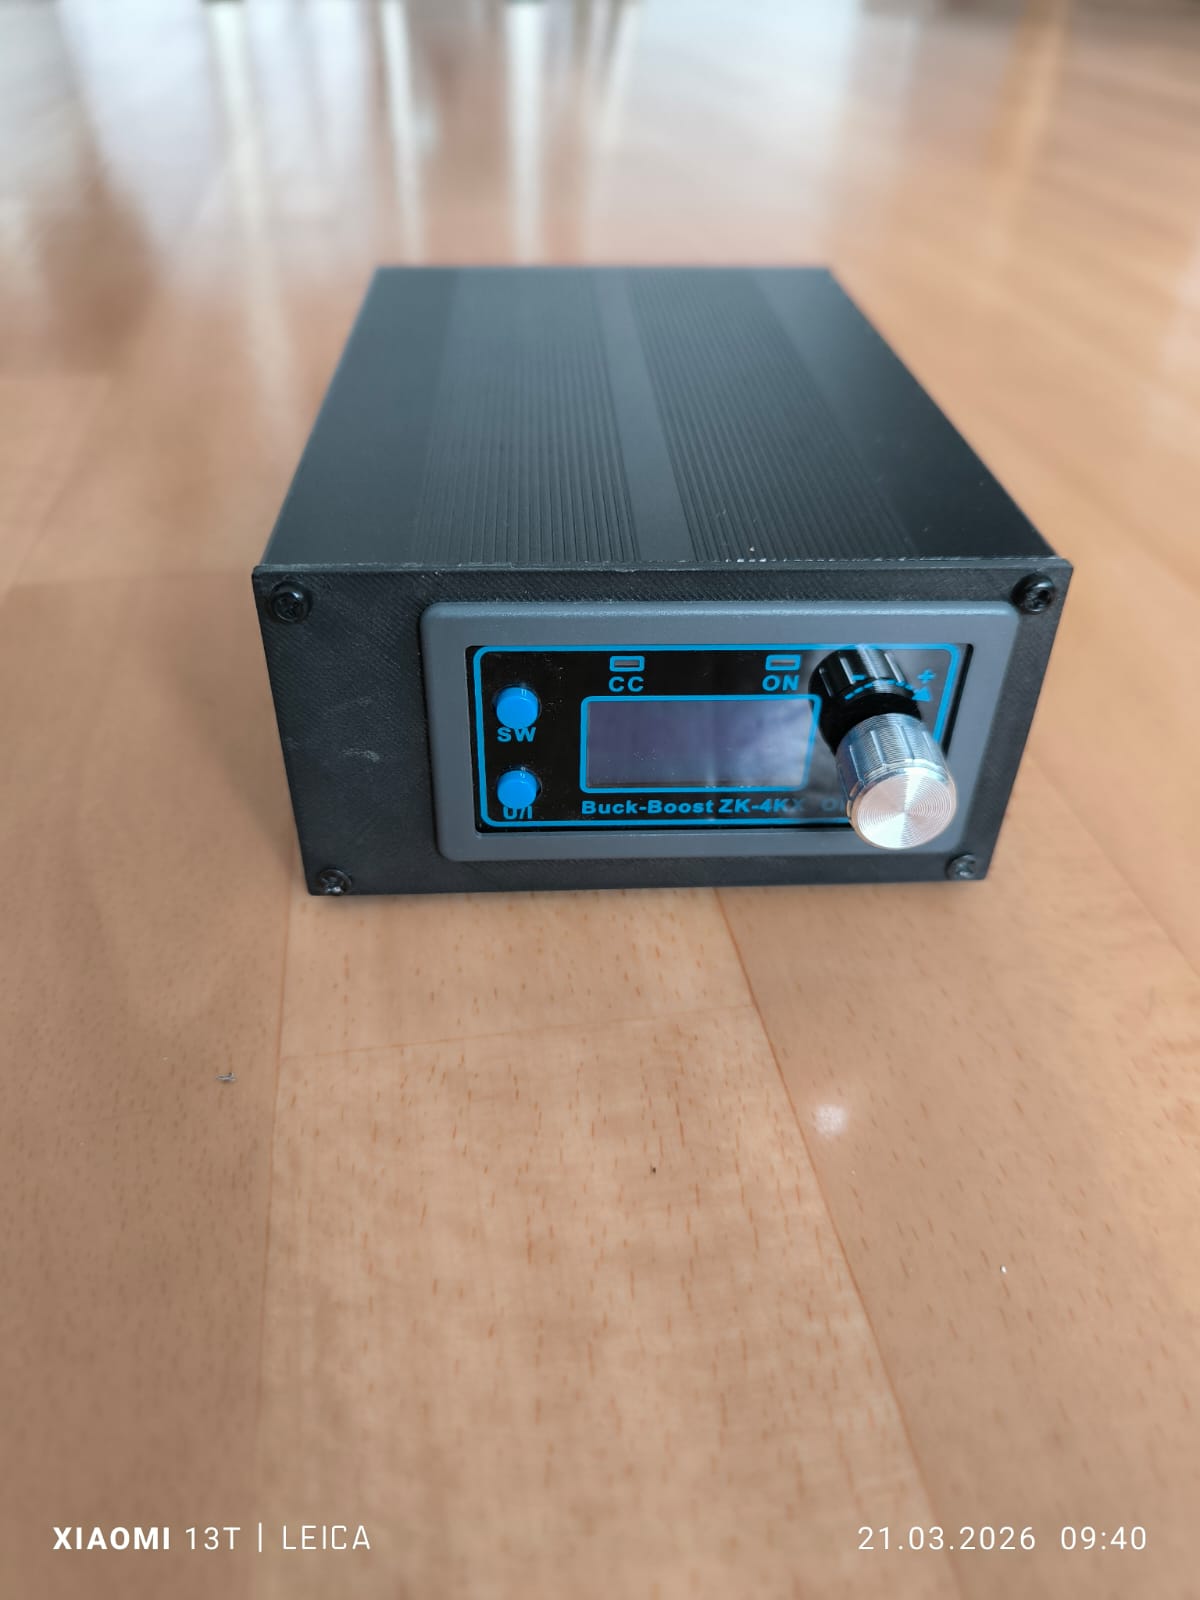
Pictures of the Second Receiver