Continuum SR
Continuum SR (Second Receiver - Continuum Live Plotter)
This program was specifically developed for the “Second Receiver” - an easy-to-build, broadband high-frequency receiver based on the AD8362 logarithmic detector, a high-resolution ADS1115 ADC, and an Arduino or ESP32 microcontroller. With this software, the high-frequency power levels measured by the receiver can be visualized as a chart in real-time, saved for later analysis, and further processed with scientific tools.
Prerequisites
To use this software, the corresponding hardware is required. The Second Receiver must be connected to the PC via USB. Important: The specific Second Receiver firmware must be installed on the used microcontroller (Arduino/ESP32). This Python program utilizes a specifically tailored serial communication protocol (including paging commands and specific delimiters) to read the data stream synchronously and without errors.
Core Features
Hardware Control & Live Acquisition
- Dynamic Connection: COM port and baud rate can be easily configured directly in the graphical user interface (GUI).
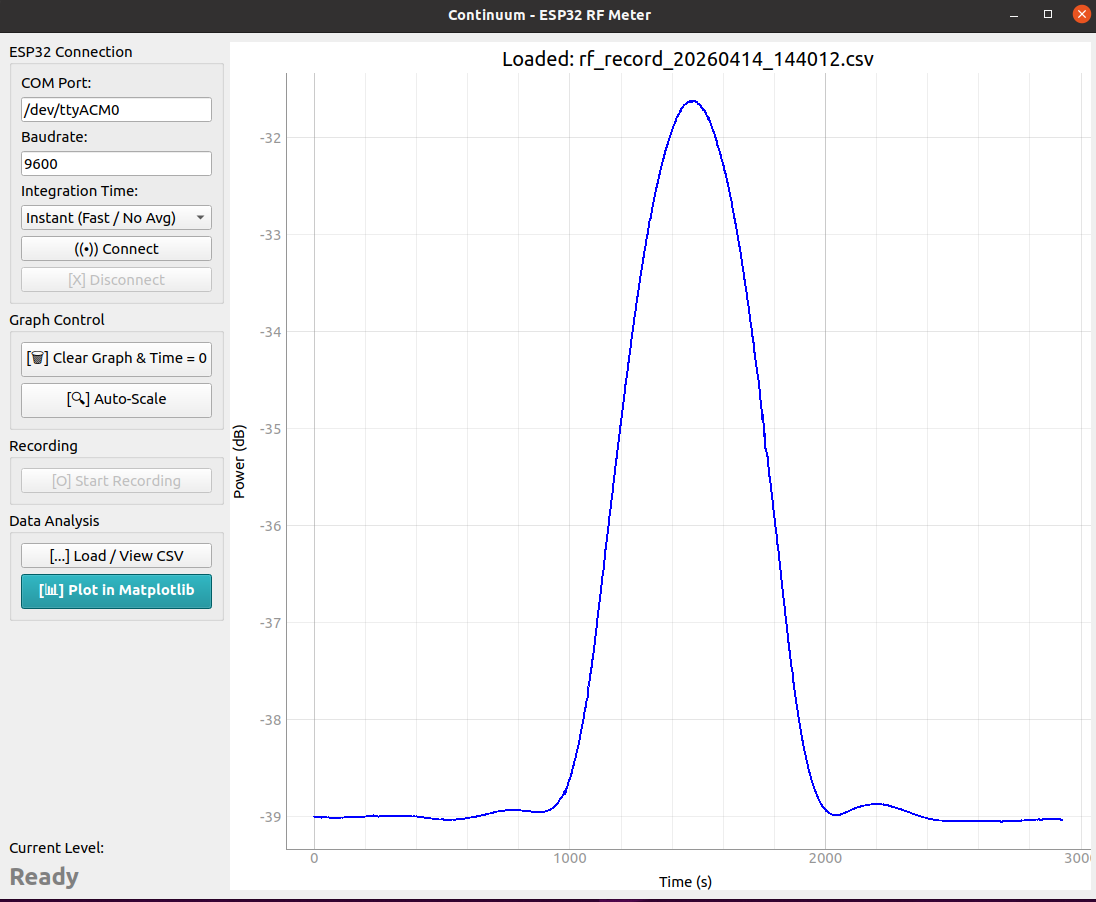
- Live Data Visualization: High-resolution and fluid real-time display of incoming dB values.
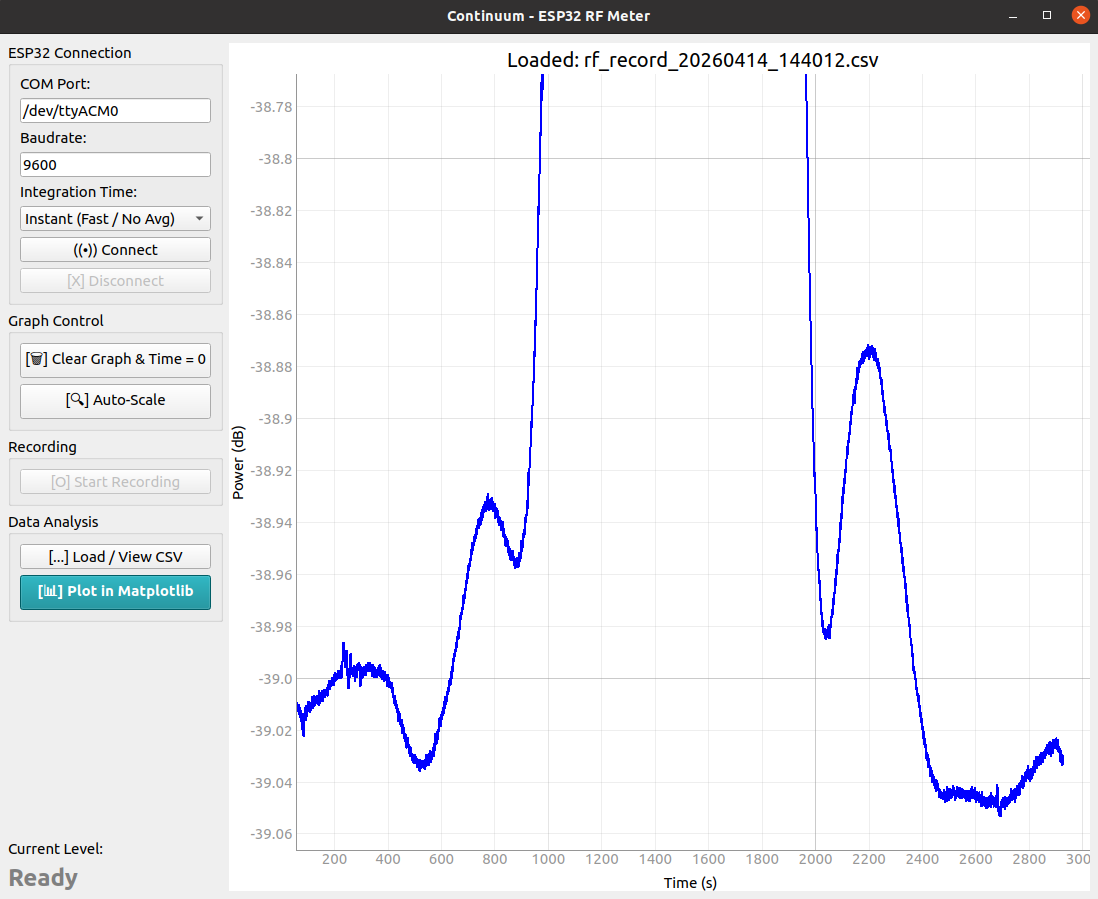
- Auto-Scaling & Zooming: The chart automatically adjusts to the signal strength. Specific areas can be interactively zoomed in and analyzed.
- Adjustable Integration Time: To improve the signal-to-noise ratio (SNR), the program offers dynamic signal smoothing. A time-based sliding window calculates the physically correct average (through internal conversion to linear power) over selectable time periods (e.g., 0.5s, 1.0s, 2.0s, 5.0s).
Data Management
- Data Logging: Measurement series can be recorded as a CSV file at the push of a button. The program stores highly precise timestamps for each measured value.
- Smart CSV Handling: Backwards compatible. The system saves using the modern standard (comma-separated) but automatically detects semicolon separations when reading older files.
- Offline File Viewer: An integrated viewing mode allows you to load and examine previously recorded measurement series (CSV) at any time, without connected hardware.
Advanced Data Processing & Analysis
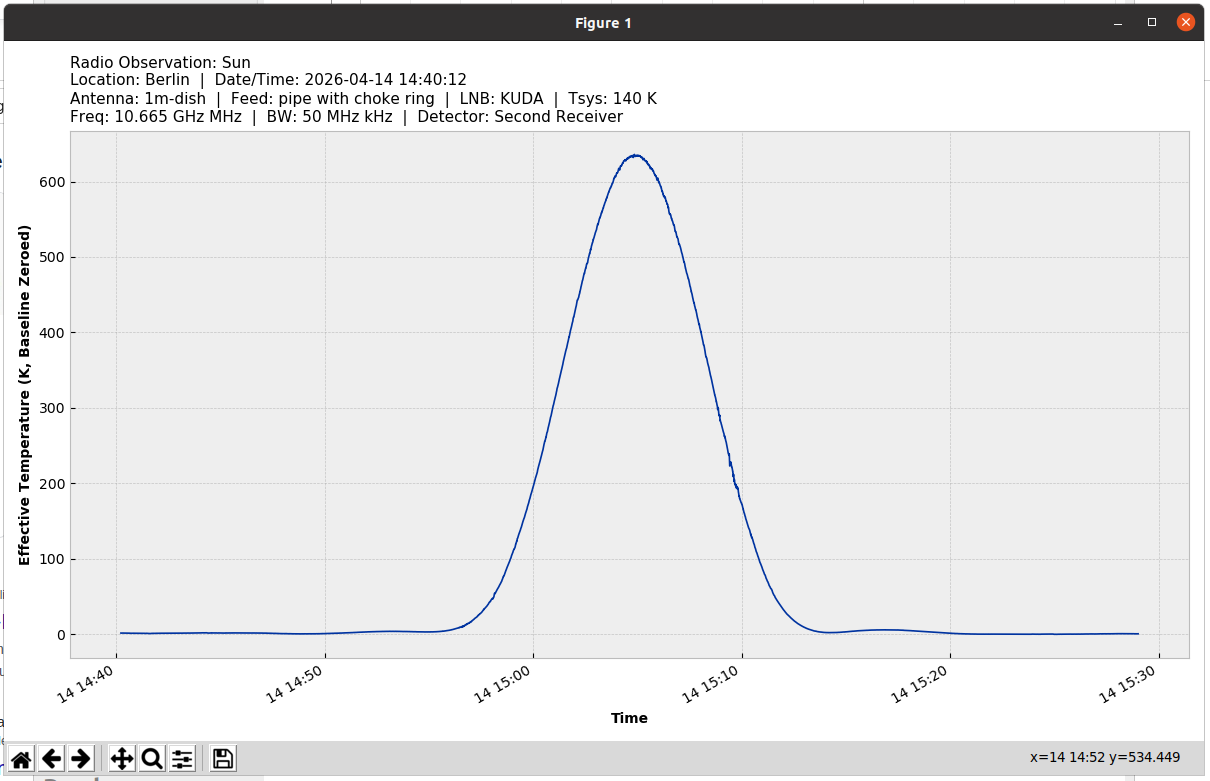
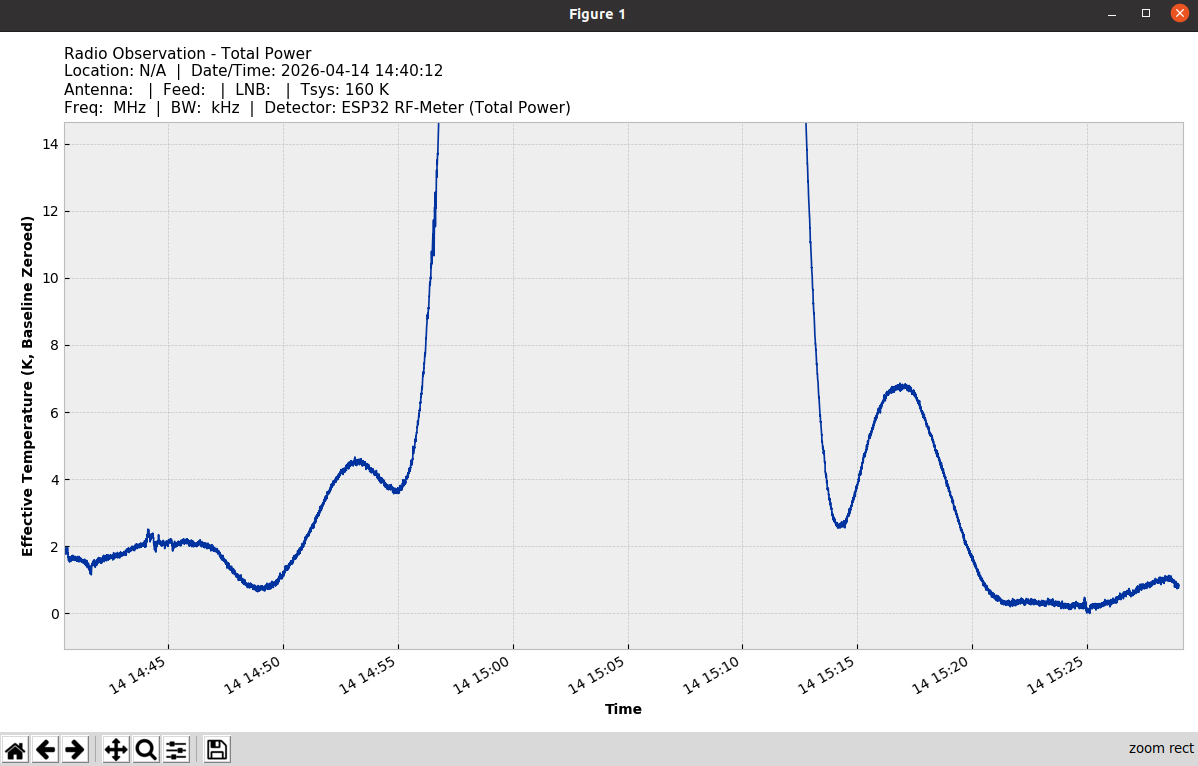
For more in-depth radio astronomical evaluations, the program offers a special analysis module: * Zeroing (Baseline Shift): The noise floor (minimum) can be subtracted to set the zero point to the baseline level of the measurement. * Linear Scale Conversion: Conversion of logarithmic dB values into relative linear power levels. * Effective Temperature Calculation: By specifying the system temperature (Tsys), the dB levels can be converted directly into the effective temperature (Kelvin).
Publication-Ready Plotting
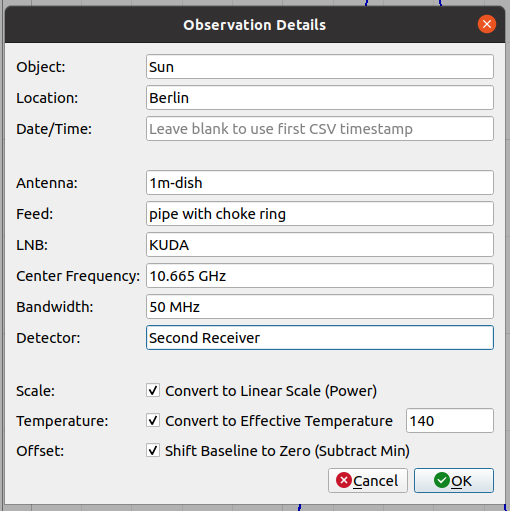
Once a measurement series is complete or loaded from a CSV, the data can be passed to Matplotlib. * Generation of high-quality, static charts perfect for scientific publications (papers, PDFs) or presentations. * Comprehensive Metadata Dialog: Before plotting, observation details such as object, location, antenna type, feed, LNB, frequency, and bandwidth can be entered. These details then appear neatly formatted as a subtitle in the final graph.
Technologies Used
- Python 3 (Runs cross-platform on Linux, Windows, macOS)
- PyQt5: For the modern and responsive user interface
- PyQtGraph: For high-performance live rendering of data streams
- Matplotlib: For high-resolution, static exports
- PySerial: For robust communication with the Arduino/ESP32