Sun
In optical astronomy, observations primarily focus on the visible surface of the Sun, the photosphere. In contrast, radio telescopes probe different layers of the solar atmosphere, depending on the observing frequency.
- GHz frequencies (microwave range) mainly probe the chromosphere
- MHz frequencies originate predominantly from the corona
This frequency dependence allows radio astronomy to access regions of the Sun that are not directly visible in optical wavelengths.
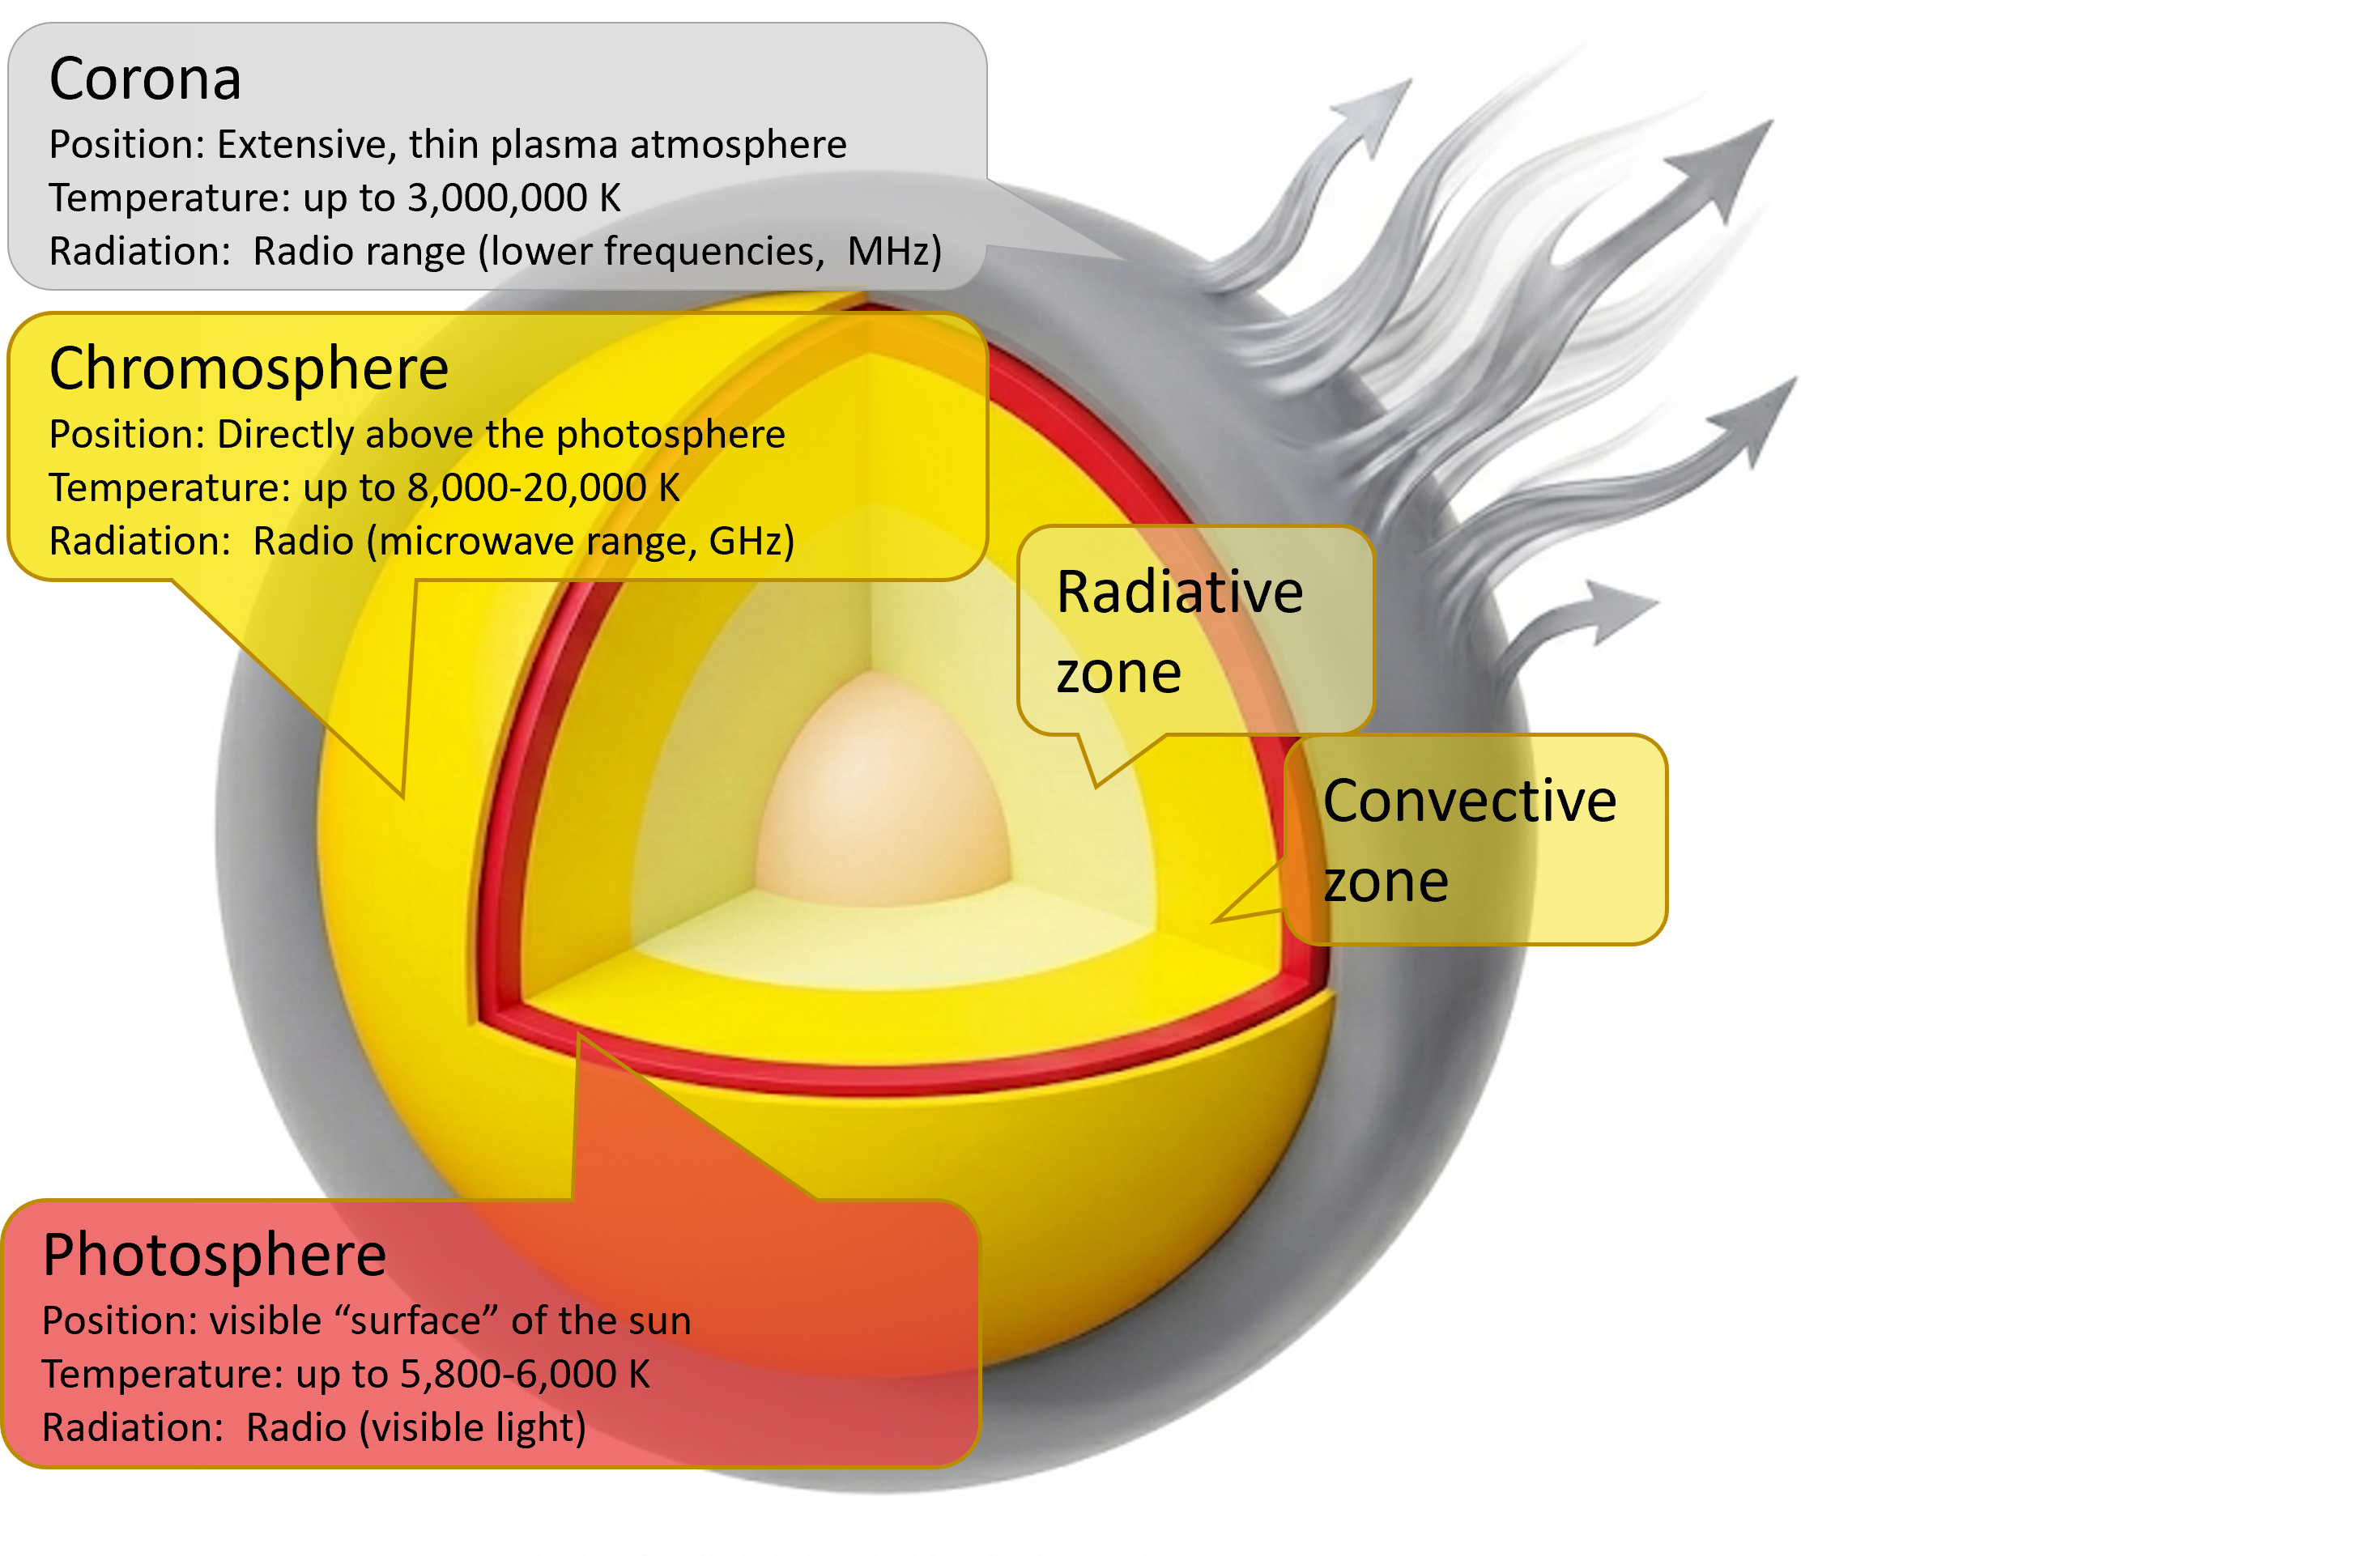
Structure and Temperature of the Solar Atmosphere
The temperature structure of the solar atmosphere is non-linear and varies significantly with height:
- Photosphere: ~6000 K
- Temperature minimum region: decreases to ~4000–4500 K
- Chromosphere: rises again up to ~20,000 K
- Corona: reaches temperatures of several hundred thousand to millions of Kelvin
Thus, radio observations at different frequencies effectively sample different temperature regimes within the solar atmosphere.
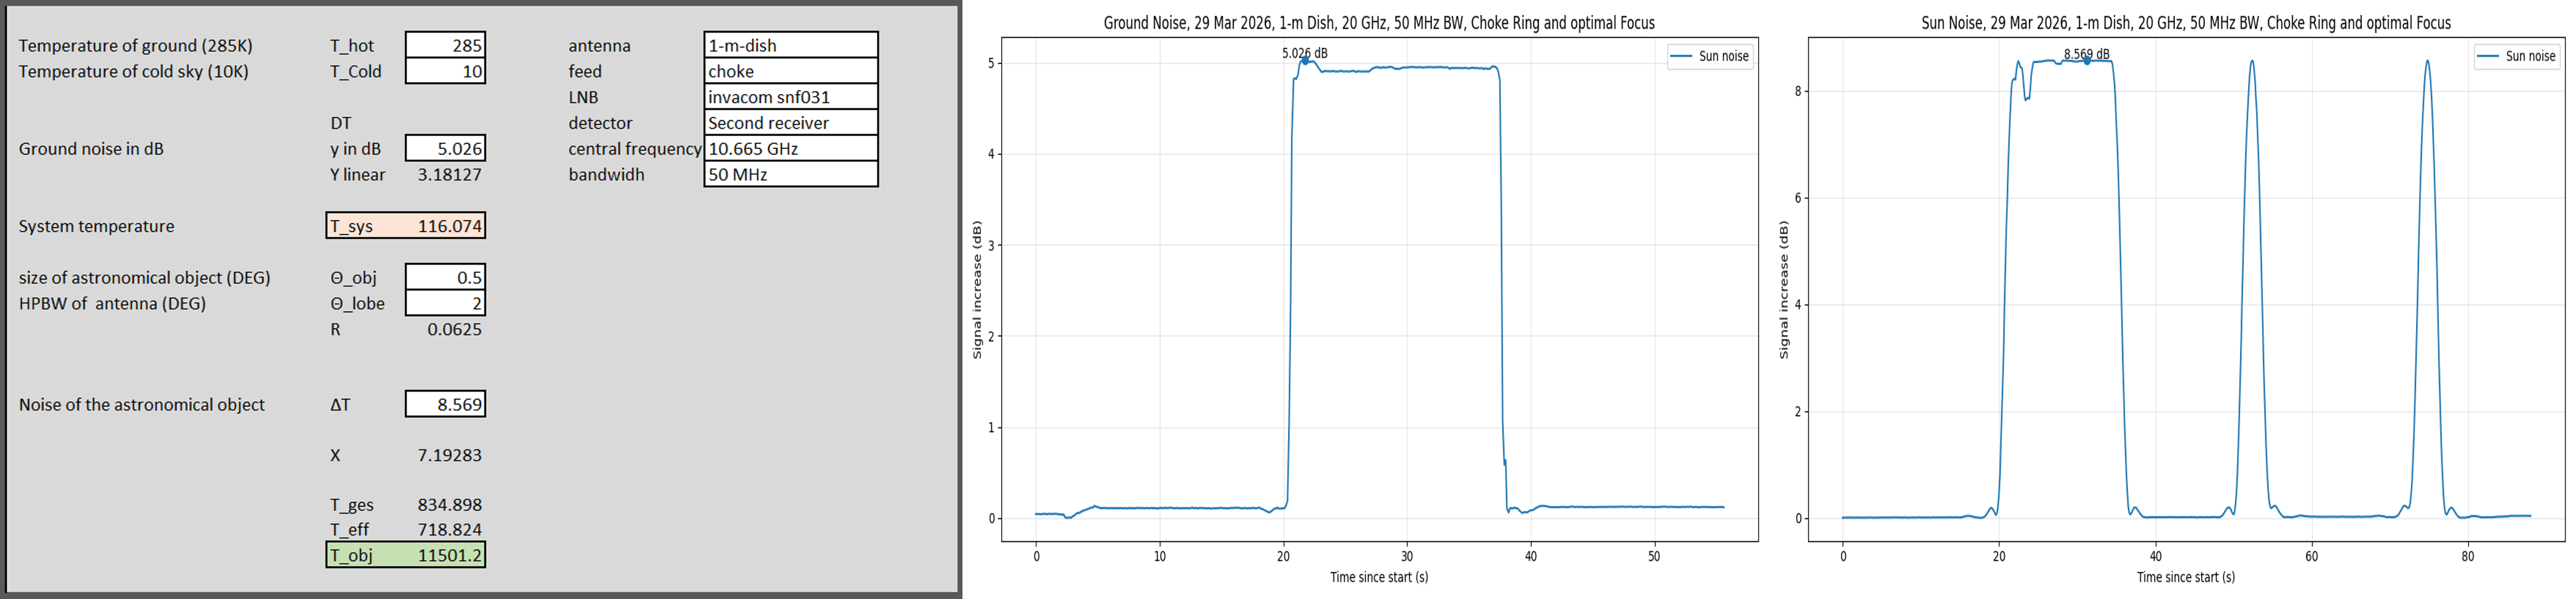
Determination of Solar Brightness Temperature
A practical method to determine temperatures in radio astronomy is the hot–cold calibration method.
- A reference measurement is taken using a cold sky (low temperature)
- A second reference is obtained from a warm object (e.g. ground, roof)
- From these measurements, the system temperature \(T_{\text{sys}}\) can be determined
- Using the radiometer equation, this allows the estimation of the brightness temperature of the Sun
Measurements in Ka-Band (Athens, March 2026)
Measurements were carried out in March 2026 using:
- a 60 cm offset dish
- a Ka-band LNB (~20 GHz)
- an RFI-polluted urban environment (Athens)
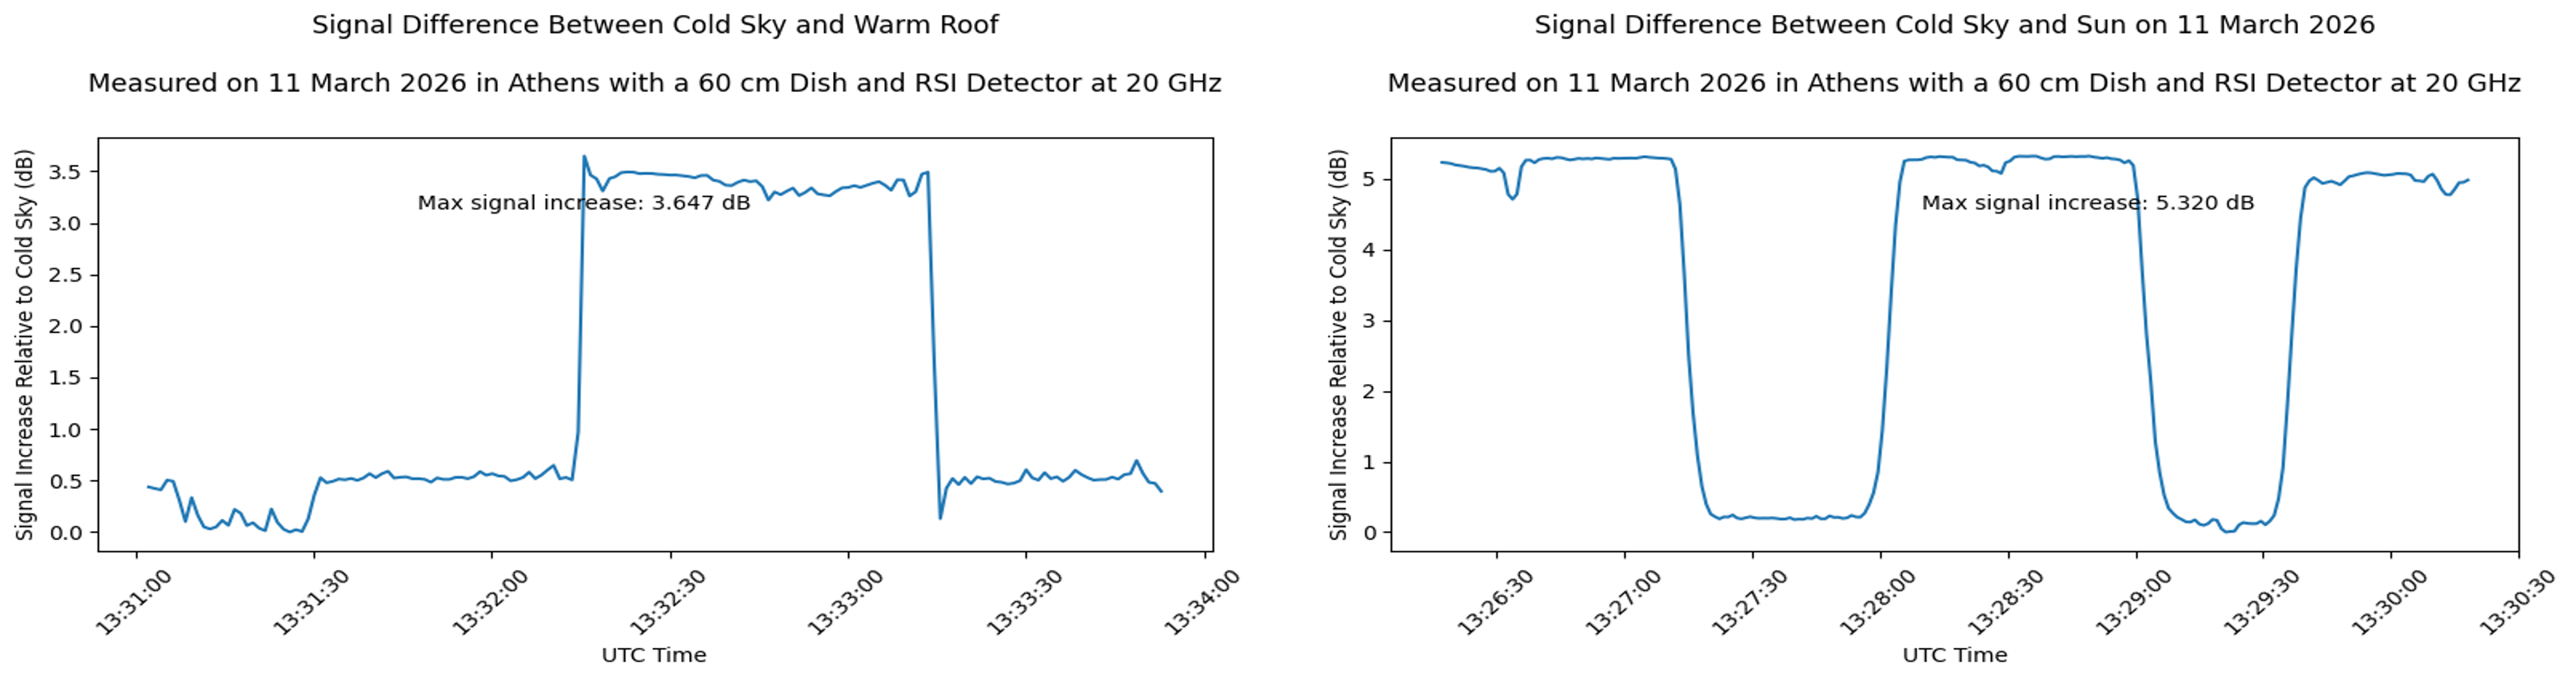
The following values were obtained:
- System temperature: \(T_{\text{sys}} \approx 262 \ \text{K}\)
- Signal increase (Sun vs. cold sky): \(\Delta T \approx 5.32 \ \text{dB}\)
From these measurements, a solar brightness temperature of approximately 8180 K was derived in the Ka-band.
This value is consistent with expectations for chromospheric emission in the microwave range.
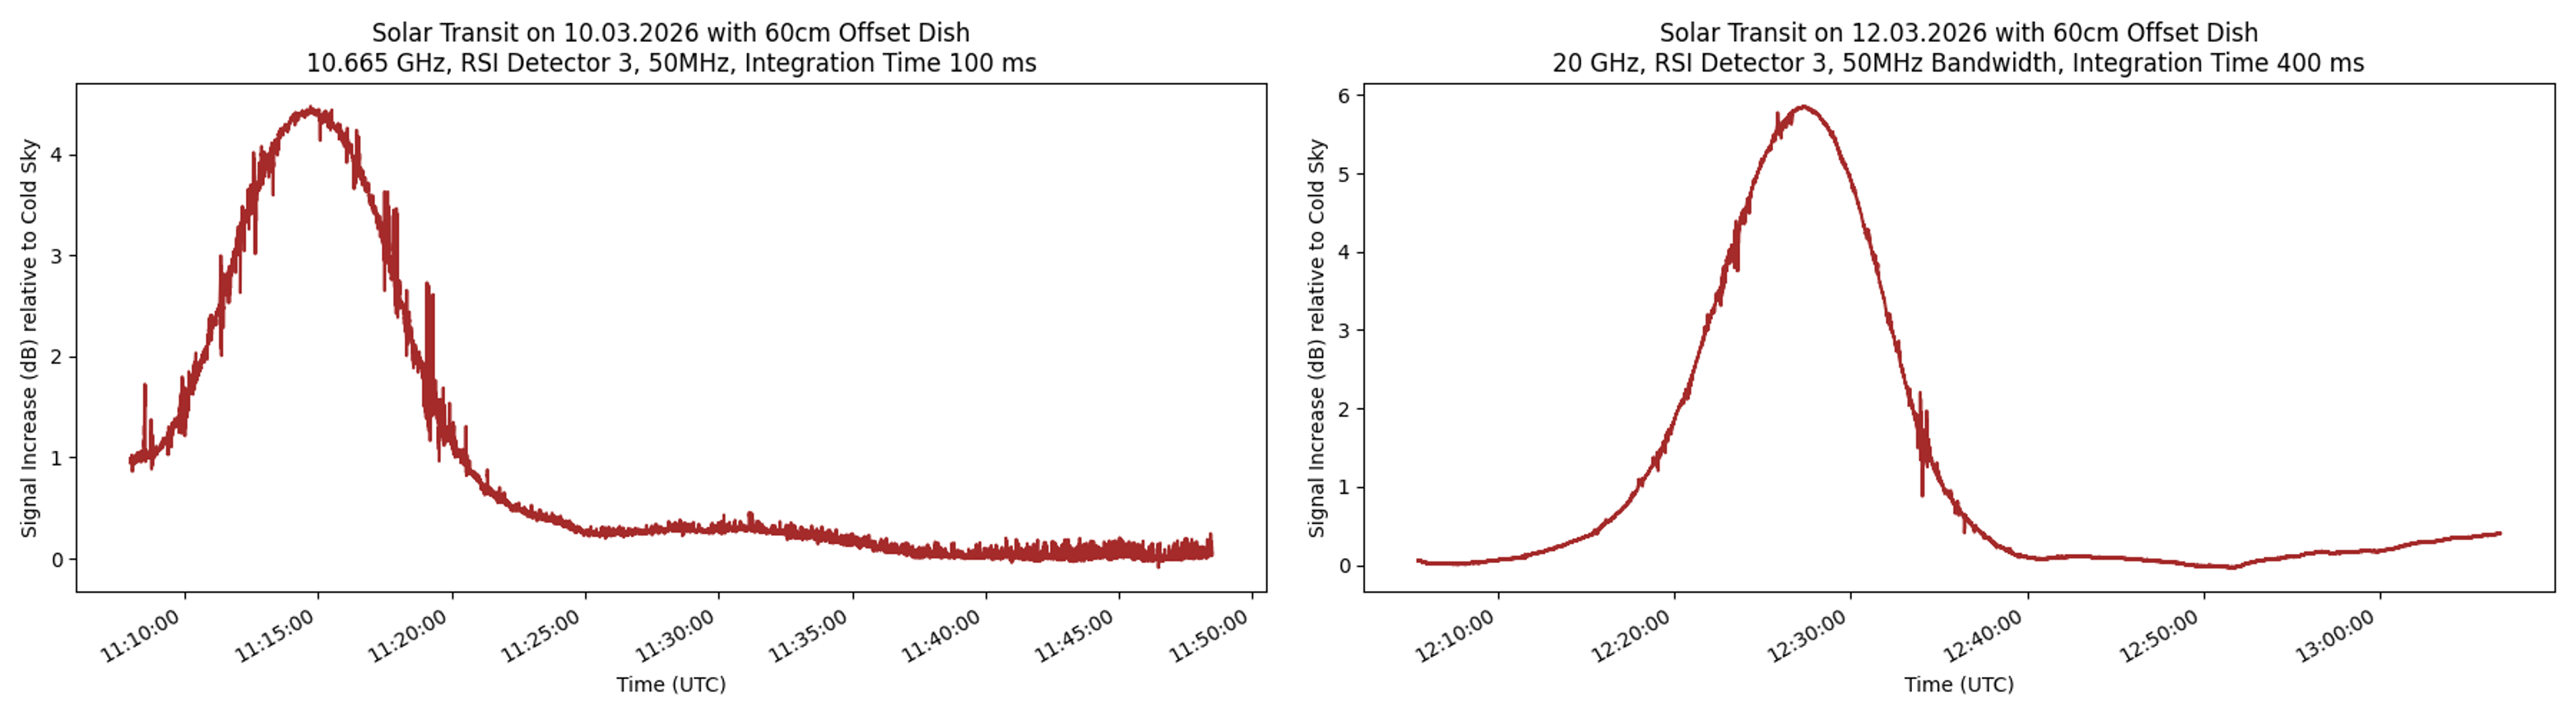
Comparison of Ka- and Ku-Band Measurements (Berlin, March 2026)
In addition to the measurements in Athens, further observations were carried out in Berlin in March 2026 to directly compare the Ka-band and Ku-band using the same 1-meter dish.
The setup included:
- Ku-band LNB: Invacom
- Ka-band LNB: Norsat
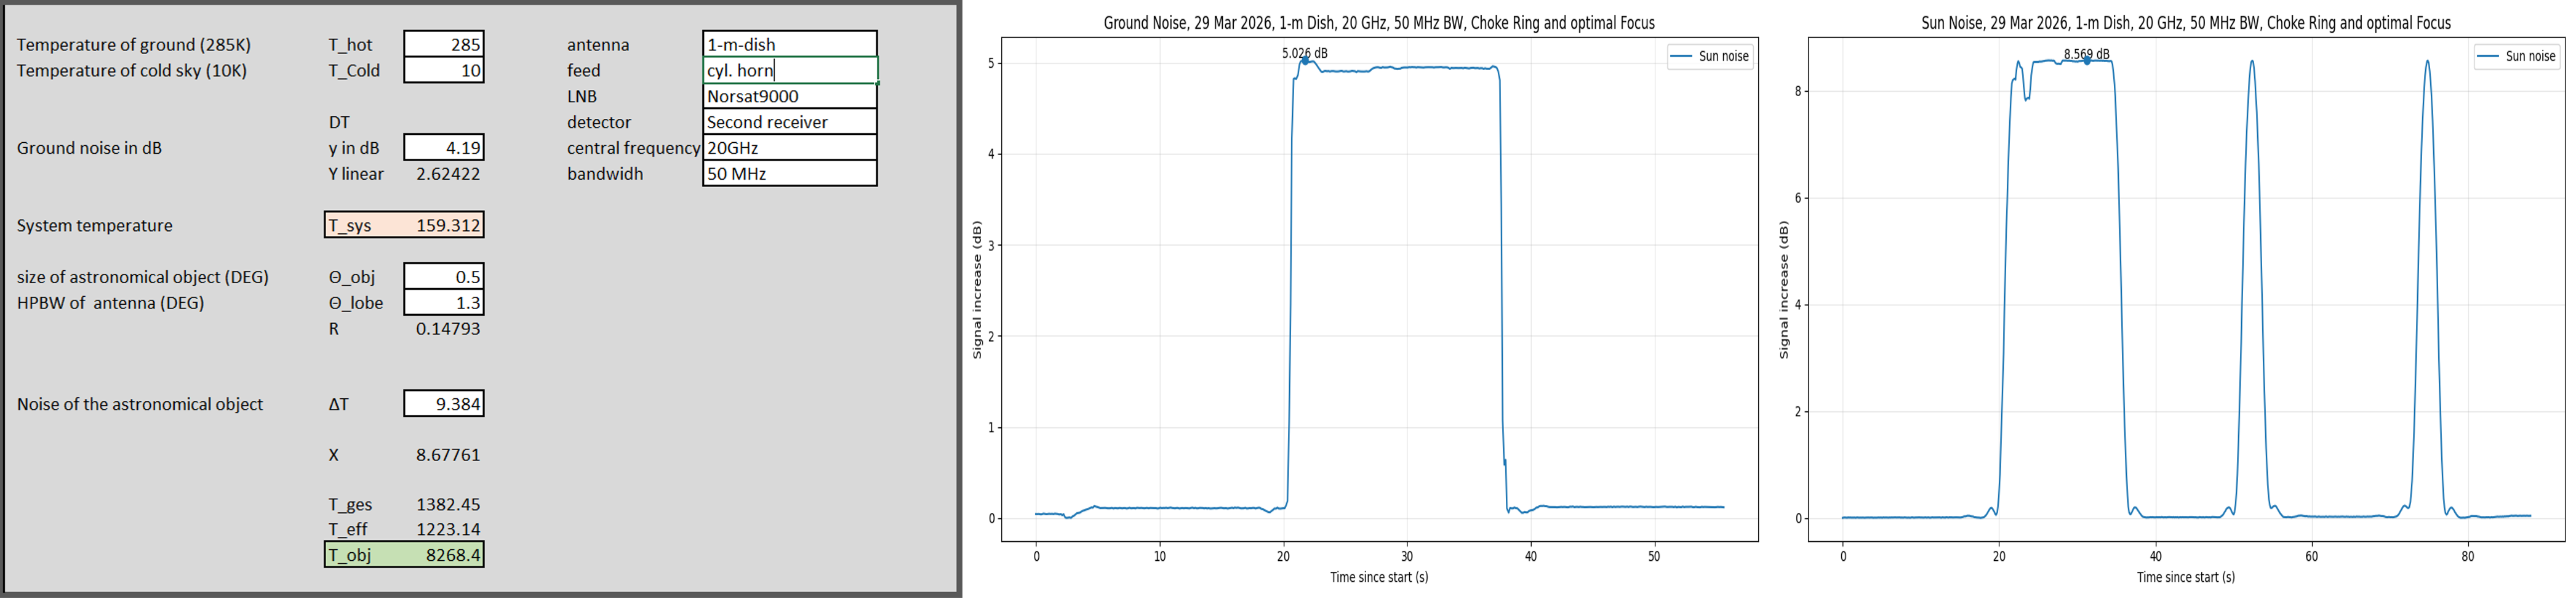
From these measurements, the following solar brightness temperatures were derived:
- Ka-band (~20 GHz): T_sys: 159.3K T_sun: 8268 K
- Ku-band (~10.665 GHz): T_sys: 116K T_sun: 11501 K
These values are physically very plausible and reflect the layered structure of the solar atmosphere.
The difference can be explained by the altitude-dependent origin of the radio emission:
In the Ku-band, the radio telescope probes higher regions of the chromosphere, where the temperature has already increased again after the temperature minimum. At even greater heights, the chromosphere gradually transitions into the corona, where temperatures rise dramatically. This leads to a higher observed brightness temperature.
In the Ka-band, the emission originates from lower regions of the chromosphere, closer to the photosphere, where temperatures are significantly lower. As a result, the measured brightness temperature is reduced compared to the Ku-band.
This comparison clearly demonstrates how observing frequency determines the atmospheric layer being probed, and therefore directly influences the measured temperature.
Solar Mapping in the Ku-Band
The last two figures show a scan of the Sun at 10.665 GHz (Ku-band) using:
- a 1-meter dish
- a bandwidth of 50 MHz
- a standard TV Ku-band LNB
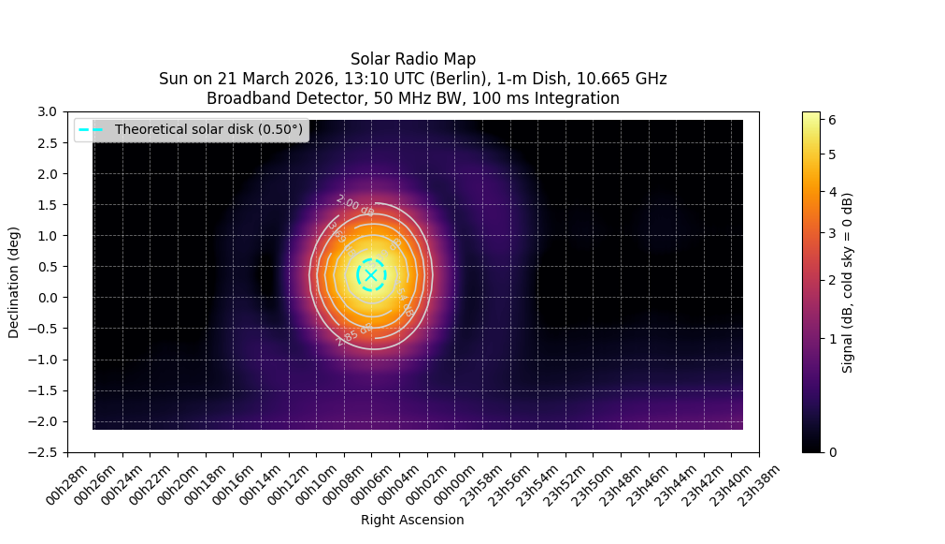
The data are presented in two forms:
- Radio map of the Sun
- Transit profile through the center of the disk
Several important features can be identified:
- The main lobe is clearly broader than the solar disk - the sun remains a point source in a small radio telescope
- The first sidelobe is clearly visible
- Additional second and third sidelobe rings are partially visible in the raw data
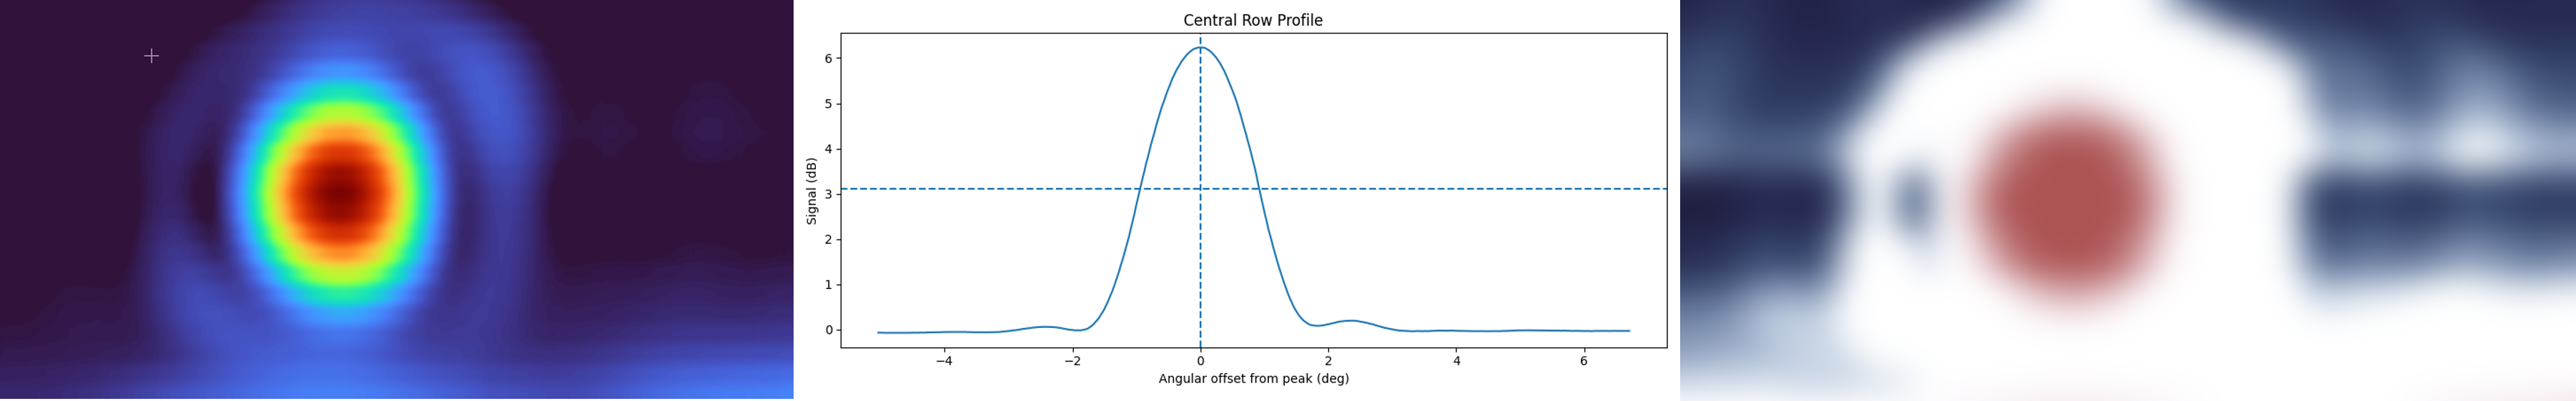
These observations demonstrate that even relatively small amateur instruments are capable of producing radio maps of the Sun, including detailed beam pattern structures.
Conclusion
Radio observations provide a powerful tool to probe the temperature structure of the solar atmosphere. By combining:
- calibration techniques (hot–cold method)
- continuum measurements
- and spatial scanning
it is possible to derive meaningful physical parameters such as brightness temperature and beam characteristics, even with simple and low-cost equipment.
This once again highlights the strong connection between instrumentation, observing frequency, and astrophysical interpretation in amateur radio astronomy.